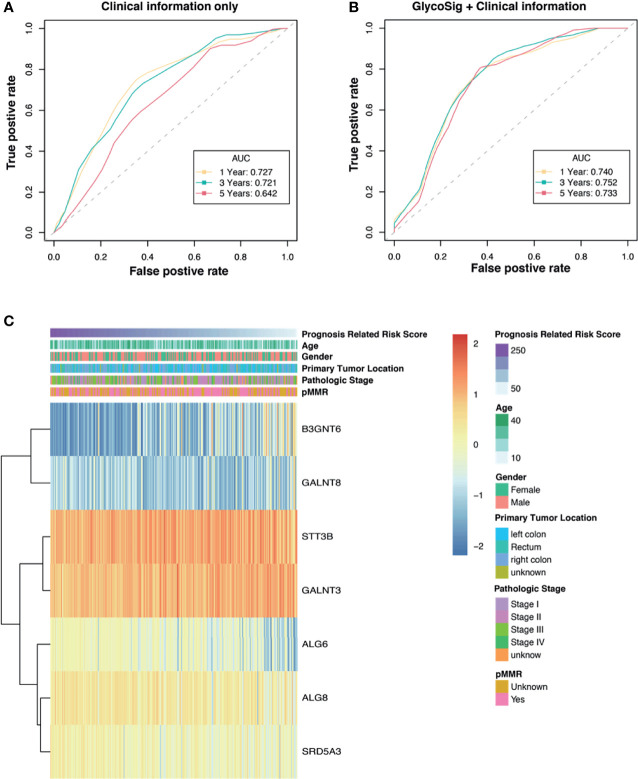
Figure 4.
The prognostic power of the GlycoSig biomarker set. Receiver operating characteristic (ROC) curve analysis of clinicopathologic information (A) and GlycoSig combined with clinical information (B); Yellow, green, and red dotted lines represent GlycoSig risk score predicting 1-, 3-, and 5-year overall survival. (C) Heatmap of the GlycoSig combined with clinical features and messenger RNA (mRNA) expression of glycogenes in The Cancer Genome Atlas (TCGA) dataset.

