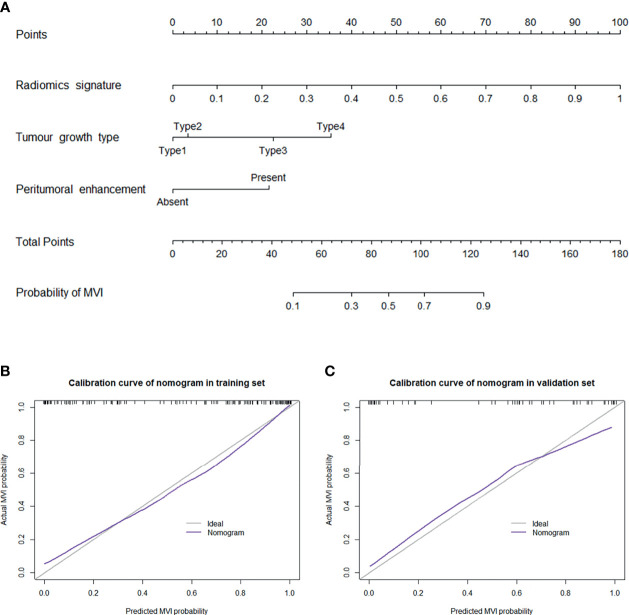
Figure 3.
(A) Nomogram for the prediction of MVI presence in patients with solitary HCC. The nomogram was established based on the MR radiomics signature and 2 independent clinicopathological risk factors: peritumoral enhancement and tumour growth type (type 1: smooth regular nodule growth; type 2: focal extranodular growth; type 3: multinodular confluent growth; and type 4: infiltrative growth). Plots (B, C) present the calibration curve of the nomogram in the training and validation sets, respectively. The 45° gray line represents the ideal prediction, and the purple line represents the predictive performance of the nomogram. The purple line has a closer fit to the gray line, which indicates that the predicted MVI probability has good agreement with the actual presence of MVI.

