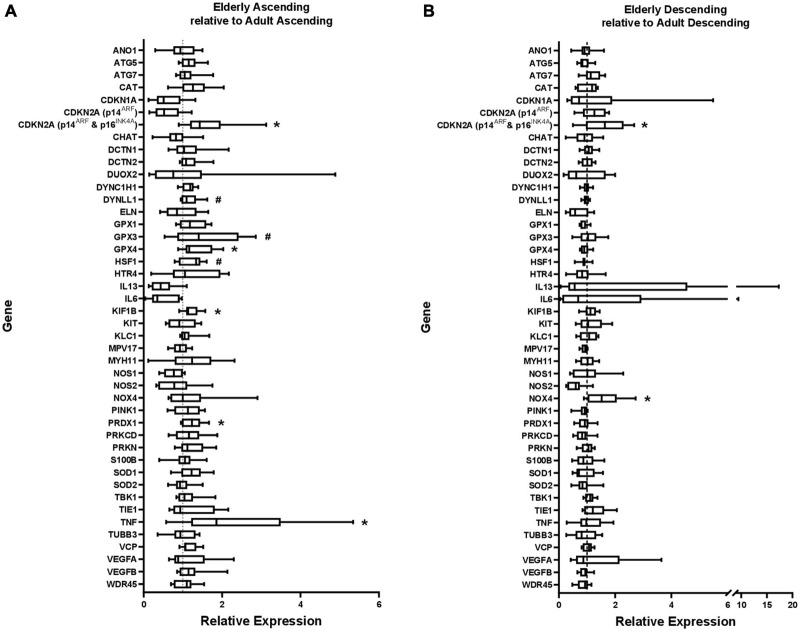
FIGURE 1.
Gene expression in (A) elderly ascending colon and (B) elderly descending colon, shown relative to gene expression in adult ascending or descending colon, which has been normalized to 1 for each gene (shown by dashed line). ATP5B and GAPDH were used as endogenous controls. Results represent fold-change differences. #p < 0.1 and *p < 0.05. Student’s t-test used to calculate P value for each gene, comparing between age groups.

