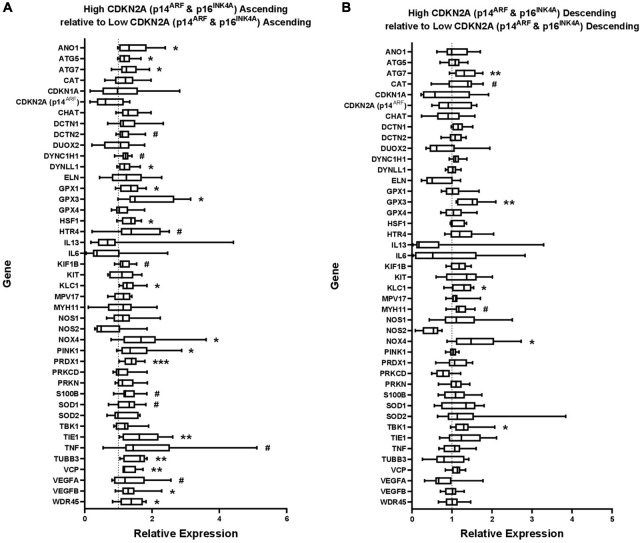
FIGURE 3.
Gene expression in (A) ascending colon and (B) descending colon with high CDKN2A (p16INK4A and p14ARF) expression, shown relative to gene expression in ascending or descending colon with low p16 expression, which has been normalized to 1 for each gene (shown by dashed line). ATP5B and GAPDH were used as endogenous controls. Results represent fold-change differences. #P < 0.1; *P < 0.05; **P < 0.01; and ***P < 0.001. Student’s t-test used to calculate P value for each gene, comparing between age groups.

