
Figure 9.
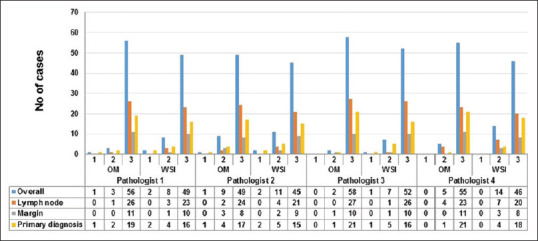
Bar diagram shows the overall level of confidence of pathologists for whole-slide imaging and OM according to specimen types
Official websites use .gov
A
.gov website belongs to an official
government organization in the United States.
Secure .gov websites use HTTPS
A lock (
) or https:// means you've safely
connected to the .gov website. Share sensitive
information only on official, secure websites.
Bar diagram shows the overall level of confidence of pathologists for whole-slide imaging and OM according to specimen types