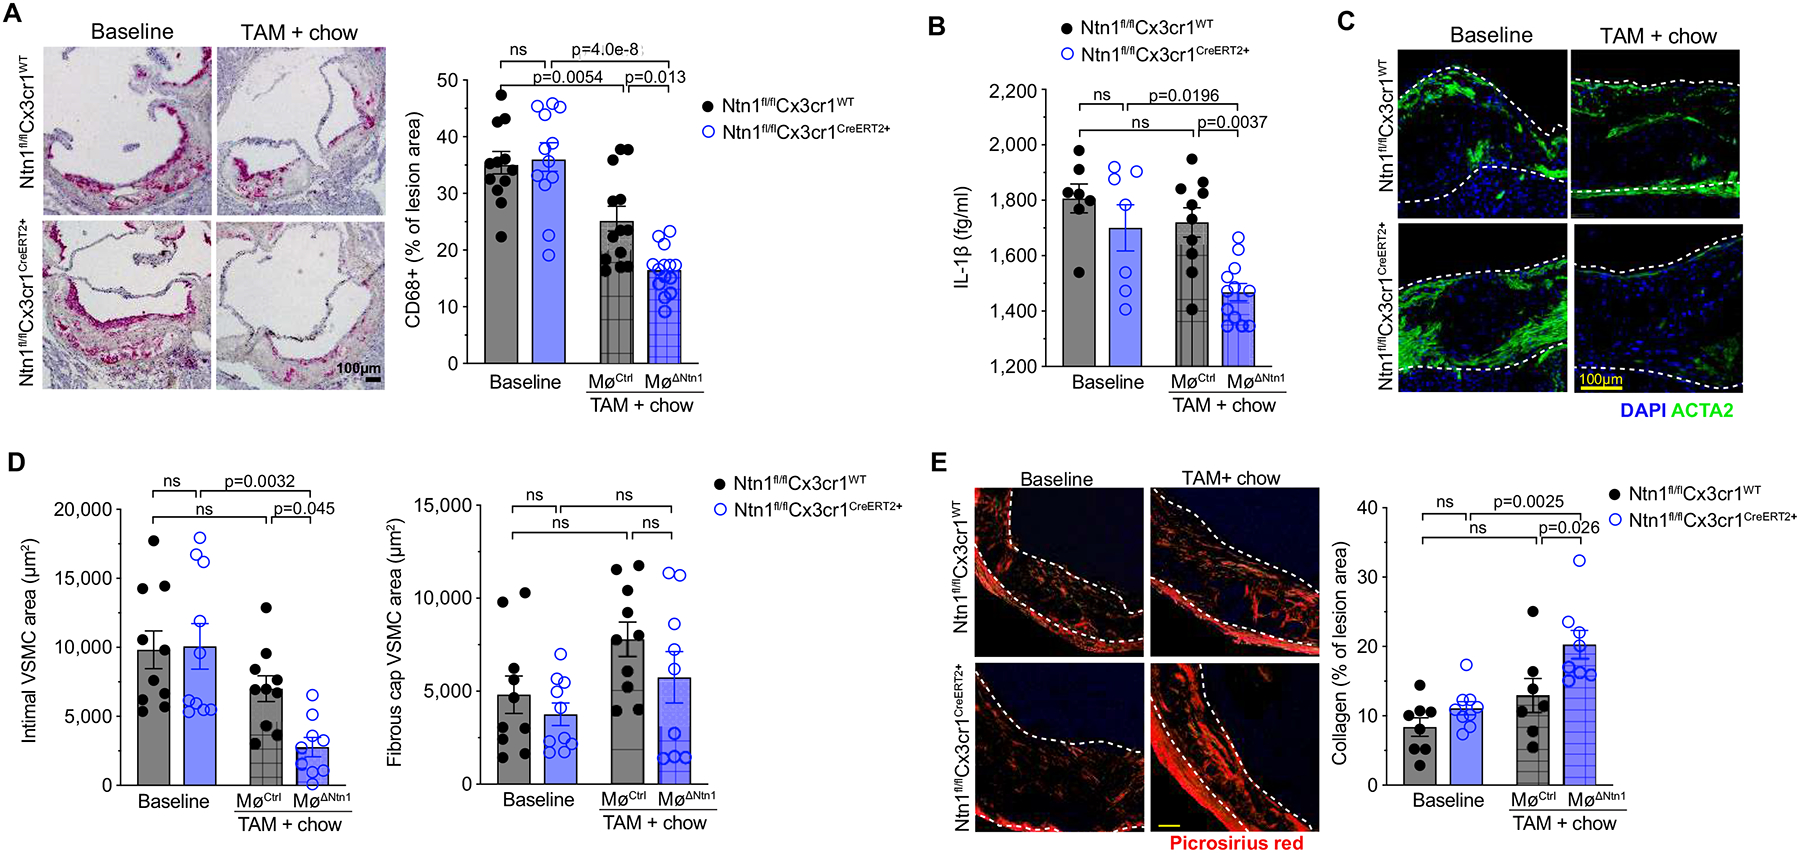
Figure 2. Deletion of netrin-1 reduces plaque macrophage and smooth muscle burden.

A) Representative images and quantification of CD68 staining in cross-sections of the aortic root (scale bar = 100 μm) of mice at baseline (Ntn1fl/flCx3cr1WT n=12, Ntn1fl/flCx3cr1CreER+ n=12) and 4 weeks after switch to chow diet and tamoxifen treatment (MøCtrl n=13, MøΔNtn1 n=14). B) Plasma levels of interleukin (IL)-1β (BL: n=7; TAM: MøCtrl n=10, MøΔNtn1 n=12). C) Representative images of alpha smooth muscle actin (ACTA2; green) and DAPI (blue) staining to detect putative vascular smooth muscle cells (VSMC) in aortic root plaques. Scale bar = 100 μm. D) Quantification of VSMC accumulation in the intima (left) and fibrous cap (right) of aortic root plaques (BL: Ntn1fl/flCx3cr1WT n=10, Ntn1fl/flCx3cr1CreER+ n=10; TAM: MøCtrl n=10, MøΔNtn1 n=9). E) Representative images and quantification of PicroSirius Red staining for collagen. Scale bar = 100 μm (BL: Ntn1fl/flCx3cr1WT n=8, Ntn1fl/flCx3cr1CreER+ n=9; TAM: MøCtrl n=7, MøΔNtn1 n=8). Data are mean ± SEM. P values were determined by [A, B, D (right panel), E] one-way ANOVA with post-hoc Tukey’s test, or [D (left panel)] Kruskal-Wallis test with Dunn’s correction.
