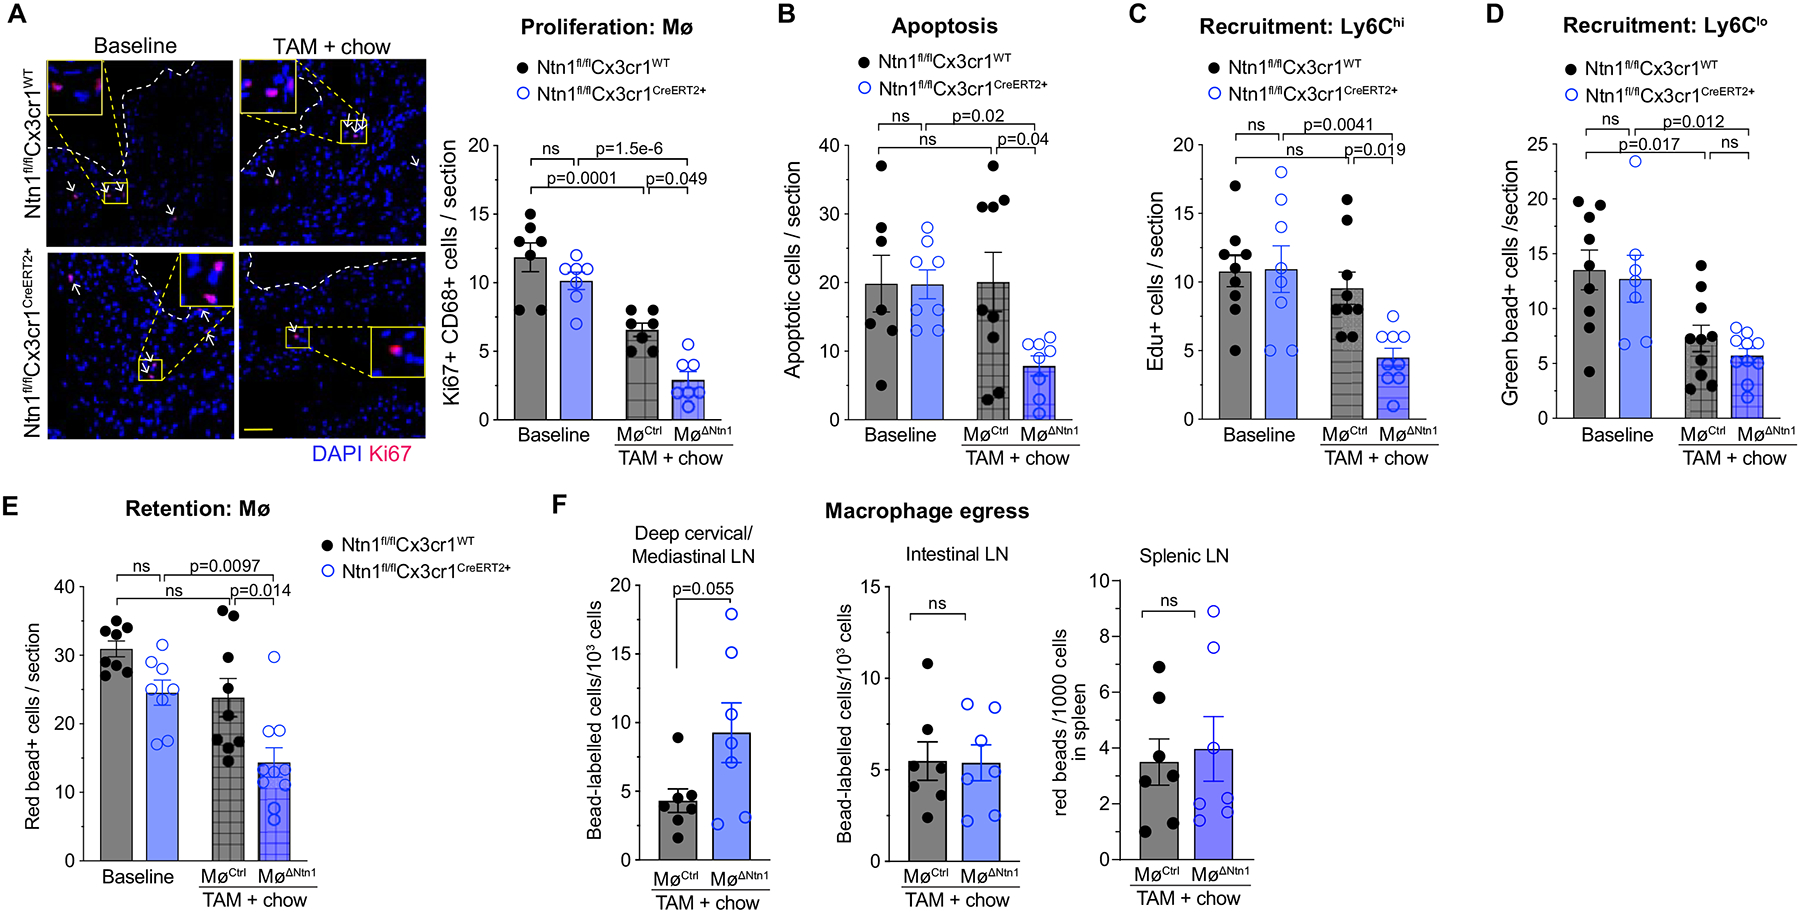
Figure 5. Deletion of netrin-1 alters monocyte – macrophage dynamics in the artery wall.

A) Representative images and quantification of immunostaining for the proliferation marker Ki67 (red) and DAPI (blue) in aortic root plaques of mice at baseline and after chow diet + tamoxifen (TAM) treatment (MøCtrl and MøΔNtn1). Scale bar = 100 μm. n = 7 mice/group. B) Quantification of TUNEL+ apoptotic cells in aortic root plaques of mice at baseline (Ntn1fl/flCx3cr1WT n=7, Ntn1fl/flCx3cr1CreER+ n=8) and after chow diet + TAM (MøCtrl n=9, MøΔNtn1 n=8). C) Quantification of EdU+ Ly6hi monocyte recruitment into aortic root plaques (BL: Ntn1fl/flCx3cr1WT n=9, Ntn1fl/flCx3cr1CreER+ n=8; TAM: MøCtrl n=9, MøΔNtn1 n=9). D) Quantification of green bead-labelled Ly6lo monocyte recruitment into aortic root plaques (BL: Ntn1fl/flCx3cr1WT n=9, Ntn1fl/flCx3cr1CreER+ n=7; TAM: MøCtrl n=10, MøΔNtn1 n=10). E) Retention of baseline-labelled macrophages in aortic root plaques of MøCtrl and MøΔNtn1 mice. (BL: Ntn1fl/flCx3cr1WT n=8, Ntn1fl/flCx3cr1CreER+ n=8; TAM: MøCtrl n=9, MøΔNtn1 n=10). F) Quantification of bead labeled macrophages in the mediastinal, intestinal, and splenic lymph nodes (LN) of MøCtrl and MøΔNtn1 (n=7 mice/group). A-F) Data are mean ± SEM. P values were determined by (A-E) one-way ANOVA with post-hoc Tukey’s test, or (F) two tailed Student’s t-test for mediastinal and intestinal LN; or Mann-Whitney test for Spleen LN.
