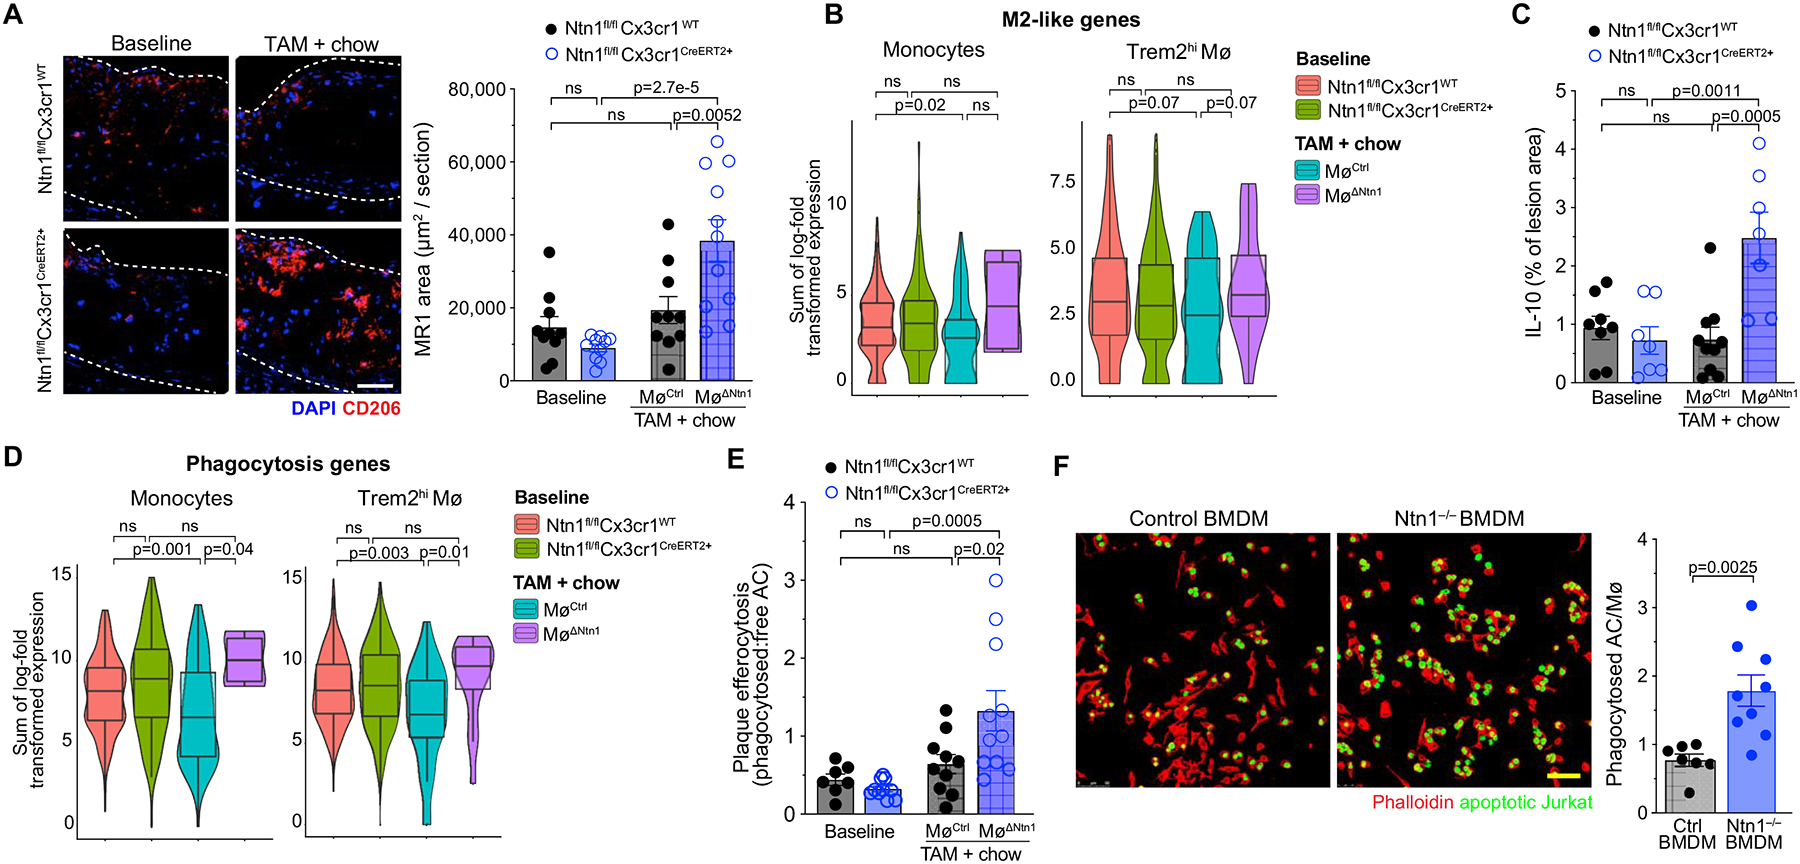
Figure 7. Deletion of Netrin-1 promotes a proresolving macrophage phenotype in the regressing plaque.

A) Representative immunostaining and quantification for mannose receptor (MR1; red) and DAPI (blue) in aortic root plaques of mice at baseline (n=10/group) and after chow diet + tamoxifen (TAM) treatment (MøCtrl n=10, MøΔNtn1 n=11). Scale bar = 100 μm. B) Violin plots of the sum of log-transformed normalized expression for the 21 most highly expressed genes of M2-like macrophages. C) Quantification of immunostaining for interleukin (IL)-10 in aortic root plaques of mice at baseline (Ntn1fl/flCx3cr1WT n=8, Ntn1fl/flCx3cr1CreER+ n=7) and after chow diet + TAM treatment (MøCtrl n=10, MøΔNtn1 n=7). D) Violin plots of the sum of log-transformed normalized expression for the most highly expressed phagocytosis genes (GO: 0006909). E) Quantification of efferocytosis of apoptotic cells in aortic root plaques of mice at baseline (Ntn1fl/flCx3cr1WT n=7, Ntn1fl/flCx3cr1CreER+ n=10) and after chow diet + TAM treatment (MøCtrl n=10, MøΔNtn1 n=10). F) Representative images and quantification of in vitro efferocytosis of apoptotic Jurkat cells (green) by control (n=7) and Ntn1–/– (n=9) bone marrow derived macrophages (BMDM). Scale bar = 50 μm. (B+D) Box plots represent mean ± IQR and 95%-CI; P-values were calculated using a two-sided Wilcoxon rank-sum test. (A,C,E-F) Data are mean ± SEM. P values were determined by one-way ANOVA with post-hoc Tukey’s test (A,C, E) or Student’s t-test (F).
