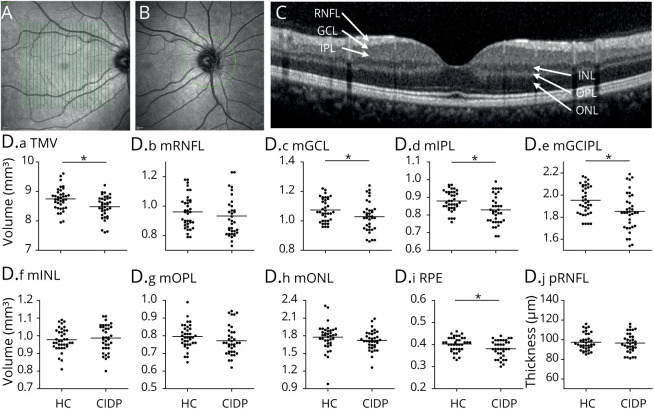
Figure 2. OCT Measurements.
(A) The macular thickness and volume were calculated from consecutive vertical scans centered on the macula. (B) The peripapillary RNFL was evaluated in a circular scan centered on the optic disk. (C) The deeper retinal layers were semiautomatically segmented in a single horizontal foveal scan. The volumes of the retinal layers were assessed by averaging 14 images from vertical scans. (D) Scatter plots display the macular layer volumes or thickness. All values are described as mean ± SD. Each point represents 1 eye. The mean of all eyes is represented by the horizontal line. Statistical differences in patients with CIDP vs healthy controls were assessed by GEE accounting for several measurements in the same individual (2 eyes). GEE = generalized estimation equation; mGCIPL = macular ganglion cell/inner plexiform layer; mGCL = macular ganglion cell layer; mINL = macular inner nuclear layer; mIPL = macular inner plexiform layer; mONL = macular outer nuclear layer; mOPL = macular outer plexiform layer; mRNFL = macular retinal nerve fiber layer; OCT = optical coherence tomography; pRNFL = peripapillary retinal nerve fiber layer; RPE = retinal pigment epithelium; TMV = total macular volume.

