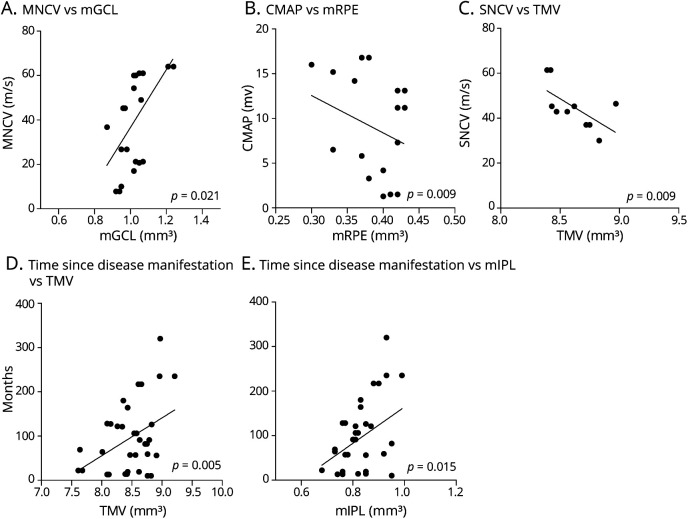
Figure 3. Analysis of Associations With Neurographic and Clinical Features.
Scatter plots of associations of retinal layers with nerve conduction and compound action potential amplitudes of the right ulnar nerve, as well as time since disease manifestation in patients with CIDP vs. healthy controls. Each dot represents 1 eye, p values (GEE method), and regression lines are provided. (A) Positive association of MNCV with mGCL (p = 0.021). (B) Negative association of CMAP with mRPE (p = 0.009). (C) Negative association of SNCV with TMV (p = 0.009). (D and E) Positive association of the time of OCT measurement since disease manifestation with TMV (D, p = 0.005) and mIPL (E, p = 0.015). CIDP = chronic inflammatory demyelinating polyneuropathy; CMAP = compound motor action potential; GEE = generalized estimation equation; mGCL, macular ganglion cell layer; mIPL, macular inner plexiform layer; MNCV, motor nerve conduction velocity; mRPE, macular retinal pigment epithelium; SNCV, sensory nerve conduction velocity; TMV, total macular volume.

