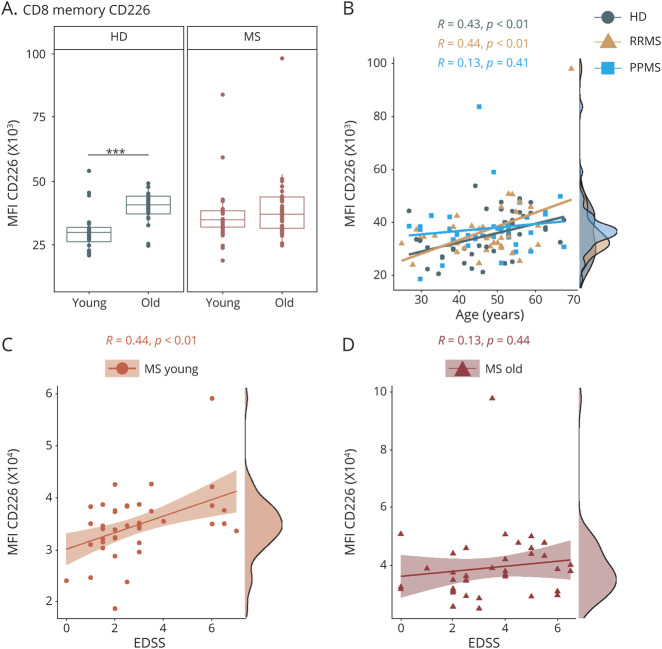
Figure 4. Age-Related Expression of the Costimulatory Molecule CD226 on T Cells in Patients With MS and HDs.
Flow cytometric analysis of frozen peripheral blood mononuclear cells from young (≤50 years) and old (>50 years) patients with MS (MS: young: n = 40, old: n = 38; RRMS: young: n = 20, old: n = 18; PPMS: young: n = 20, old: n = 20) and HDs (young: n = 20, old: n = 20). Demographic data of study subjects are depicted in eTable 1, links.lww.com/NXI/A620. (A) MFI of CD226 (DNAM-1) on memory CD8 T cells. (B) Correlation analysis of MFI of CD226 on memory CD8 T cells with age of HDs (n = 40), patients with RRMS (n = 38), and patients with PPMS (n = 40). (C, D) Correlation analysis of CD226 expression on memory CD8 T cells with the EDSS score of young (C) and old (D) patients with MS. Data are displayed as boxplots of the median and the 25th and 75th percentile ± interquartile range. Statistical analysis was conducted by the 2-tailed Mann-Whitney test. For correlation analysis, the Pearson product-moment correlation coefficients (Pearson R) were computed. Differences were considered statistically significant with the following p values: **p < 0.01 and ***p < 0.001. EDSS = Expanded Disability Status Scale; HD = healthy donor; MS = multiple sclerosis; MFI = mean fluorescence intensity; PPMS = primary progressive MS; RRMS = relapsing-remitting MS.

