Figure 7.

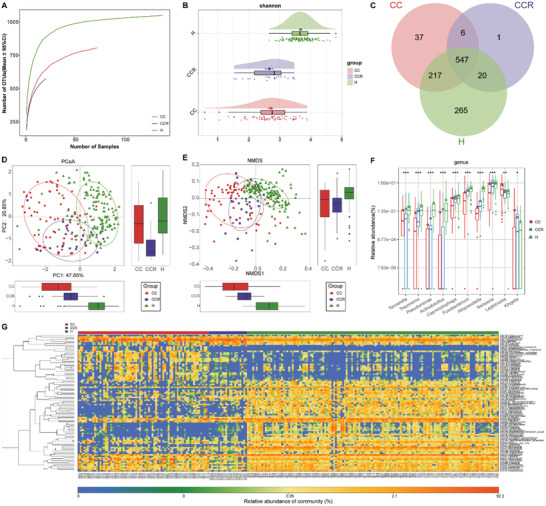
Association between oropharyngeal microbial and the recovery of patients with SARS‐CoV‐2 infection. A) Rarefaction analysis revealed that as the number of samples increased, the number of OTUs approached stable in CCs (n = 73), CCRs (n = 21) and Hs (n = 140). Compared with the Hs, the number of OTUs in CCs and CCRs was depleted. B) As evaluated by the Shannon index, oropharyngeal microbial diversity in the CCRs was similar to that in the CCs (p > 0.05) but remarkedly reduced compared with that in the Hs (all p < 0.001). C) A Venn diagram exhibited that 547 of 1093 OTUs were shared in the CC, CCR and H groups, while 265 OTUs were unique to Hs. The PCoA D) and NMDS E) showed that the oropharyngeal microbiota in the CCRs were different from those in the CCs and Hs. F) The relative abundances of 8 genera gradually enriched and were remarkedly different among three groups, while the abundances of 2 genera gradually reduced and were remarkedly different among three groups along with recovery of COVID‐19. G) Heatmap for the relative abundances of differential OTUs for each sample in the three groups. * p < 0.05, ** p < 0.01, *** p < 0.001. OTUs, operational taxonomic units; CCs, confirmed cases; CCRs, confirmed cases who recovered; Hs, healthy controls; PCoA, principal coordinate analysis; NMDS, nonmetric multidimensional scaling; COVID‐19, coronavirus disease 2019. Centerline, median; box limits, upper and lower quartiles; circle or square or triangle symbol, mean; error bars, 95% CI.
