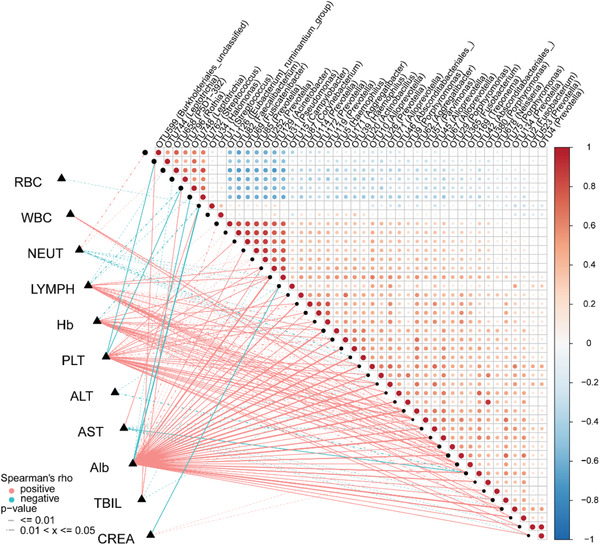
Figure 8.

Correlation between the oropharyngeal microbiota and clinical indicators. Heatmap showing the partial Spearman's correlation coefficients among 44 distinctive oropharyngeal OTUs and 11 clinical indicators between CCs (n = 48) and Hs (n = 94). OTUs, operational taxonomic units; CCs, confirmed cases; Hs, healthy controls; RBC, red blood cell; WBC, white blood cell; NEUT, neutrophils; LYMPH, lymphocytes; Hb, hemoglobin; PLT, platelets; ALT, alanine aminotransferase; AST, aspartate aminotransferase; Alb, albumin; TBIL, total bilirubin; CREA, creatinine. The red line represents a positive correlation, and the blue line represents a negative correlation.
