
Figure 5.
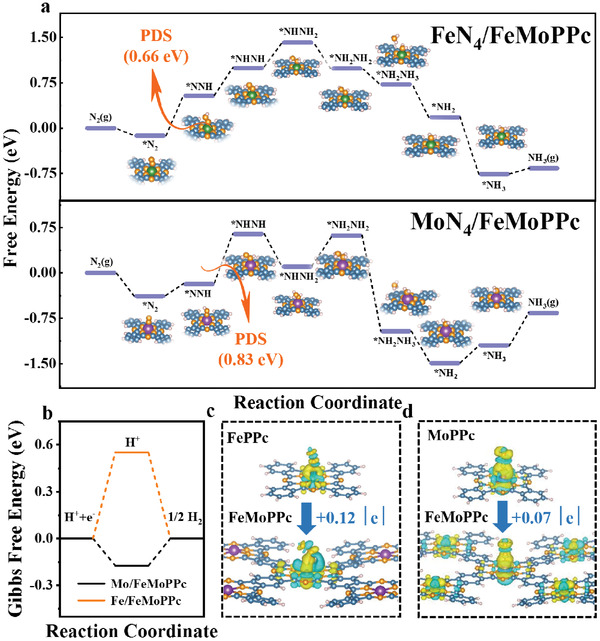
DFT calculations of the NRR activity on FeMoPPc catalysts. a) Different free‐energy diagrams for the NRR on Fe atoms of FeMoPPc and Mo atoms of FeMoPPc. b) Different free‐energy diagrams for the HER on Fe atoms of FeMoPPc and Mo atoms of FeMoPPc. c) The charge density differences calculations of N2 bonded to Fe atoms of FePPc and FeMoPPc (the electron excess area and electron deficiency area are represented by yellow and blue‐green, respectively). d) The charge density differences calculations of the N2 bonded to Mo atoms of MoPPc and FeMoPPc.