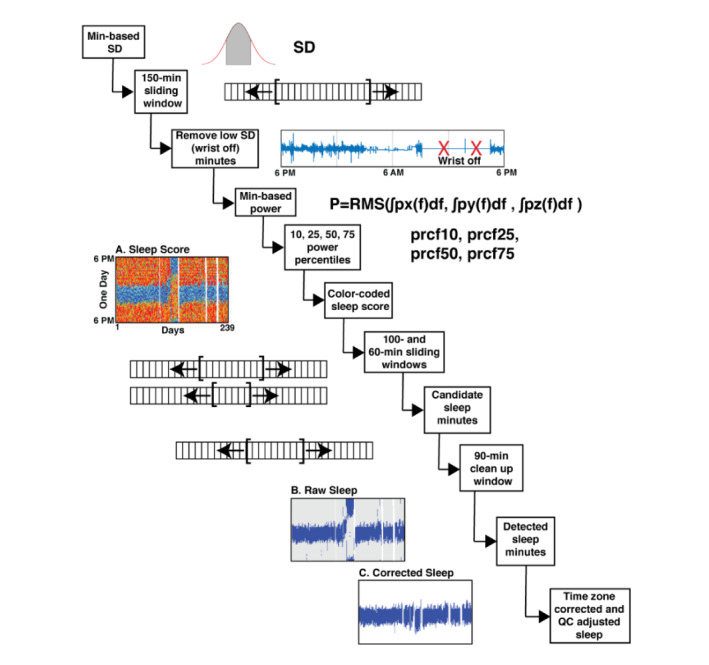
Figure 1.

The DPSleep processing pipeline. The sequential steps in the processing pipeline are illustrated with example data for key steps. The pipeline begins with raw accelerometer data and derives estimates of individualized sleep scores (A) and raw (B) and corrected Sleep Episodes (C). Sleep variables are calculated based on the corrected Sleep Episodes as estimated in C. Specifically, as the first step, the SD of the acceleration along three axes is averaged over 150-minute windows forward and backward to find the wrist-off minutes. The power density spectrum of the acceleration signal is calculated at different frequencies, and the area under the curve estimates power as the root mean squared integrated over the three axes. Minutes are classified based on 10, 25, 50, and 75 percentile thresholds and can be visualized (A; blue, cyan, green, orange, and red display the minutes based on increasing power scores). A series of forward and backward moving average windows is used to flag the candidate Sleep Episodes that are then further filtered to derive the raw sleep estimate (B). Quality control and adjustment for the local time zone then yield to the final corrected sleep estimate (C). QC: quality control; RMS: root mean square.
