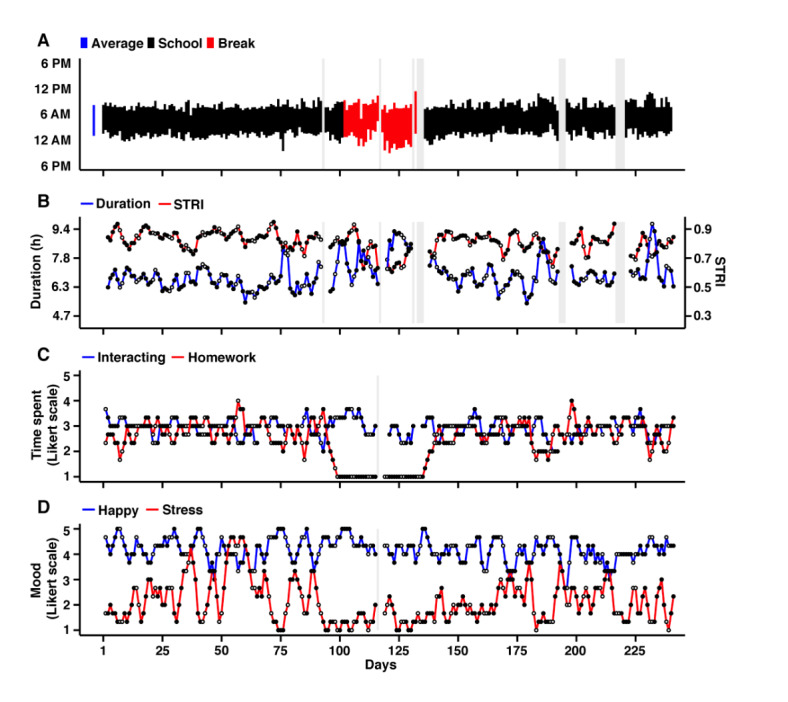
Figure 6.

Example year in the life of college student P1. Four panels display multimodality longitudinal data from the full academic year in a college undergraduate (P1 of study 1). (A) Actigraphy-based estimates of the Sleep Episode are displayed, colored by academic period (black=academic school year; red=winter break). Missing data with gray backgrounds reflect missing (wrist-off) or quality removed data (eg, on a travel day across time zones). The mean Sleep Episode is shown to the left in blue. (B) Temporally smoothed (3-day backward moving average with no missing tolerance) estimated of the sleep duration (Duration) and Sleep Timing Regularity Index. (C) Temporally smoothed estimates of time spent interacting and time spent doing homework from the self-report questionnaire. (D) Self-report estimates of mood, including happiness (Happy) and stress (Stress). This individual displays stable and regular sleep patterns with periodic deviations. Note the deviations in time spent interacting and time spent doing homework during the break period. STRI: Sleep Timing Regularity Index.
