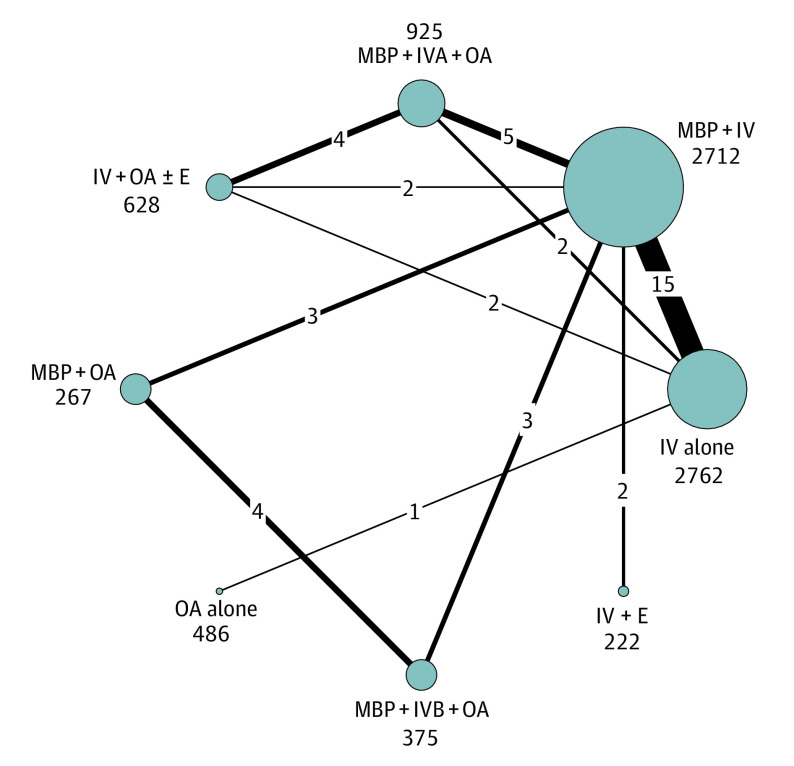
Figure 2. Network Plot of Direct Comparisons for Surgical Site Infection .
The size of the individual nodes represents the number of patients studied for each bowel preparation treatment option, and the thickness of the lines is proportional to the number of studies directly comparing the different nodes. E indicates enema; IV, intravenous antibiotics; IVA, adequate IV antibiotics; IVB, IV antibiotics with incomplete aerobic and anaerobic cover; MBP, mechanical bowel preparation; OA, oral antibiotics.

