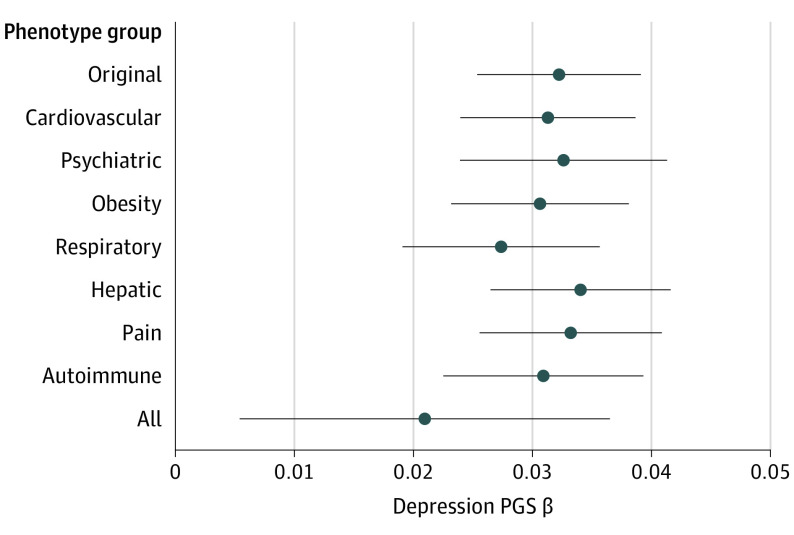
Figure 2. Analyses Controlled for Common Phenotypes Between Depression Polygenic Scores (PGS) and White Blood Cell (WBC) Count.
The association between depression PGS and WBC controlling for each “confounder” phenotype group in Vanderbilt University Medical Center. Group-based cases were any individual who was a case for any of a group’s phecodes and controls were individuals who were controls for all of a group’s phecodes. Associations were found using linear regressions controlled for each group. In the “All” analysis, all groups were controlled for in 1 regression. Whiskers indicate 95% CIs.

