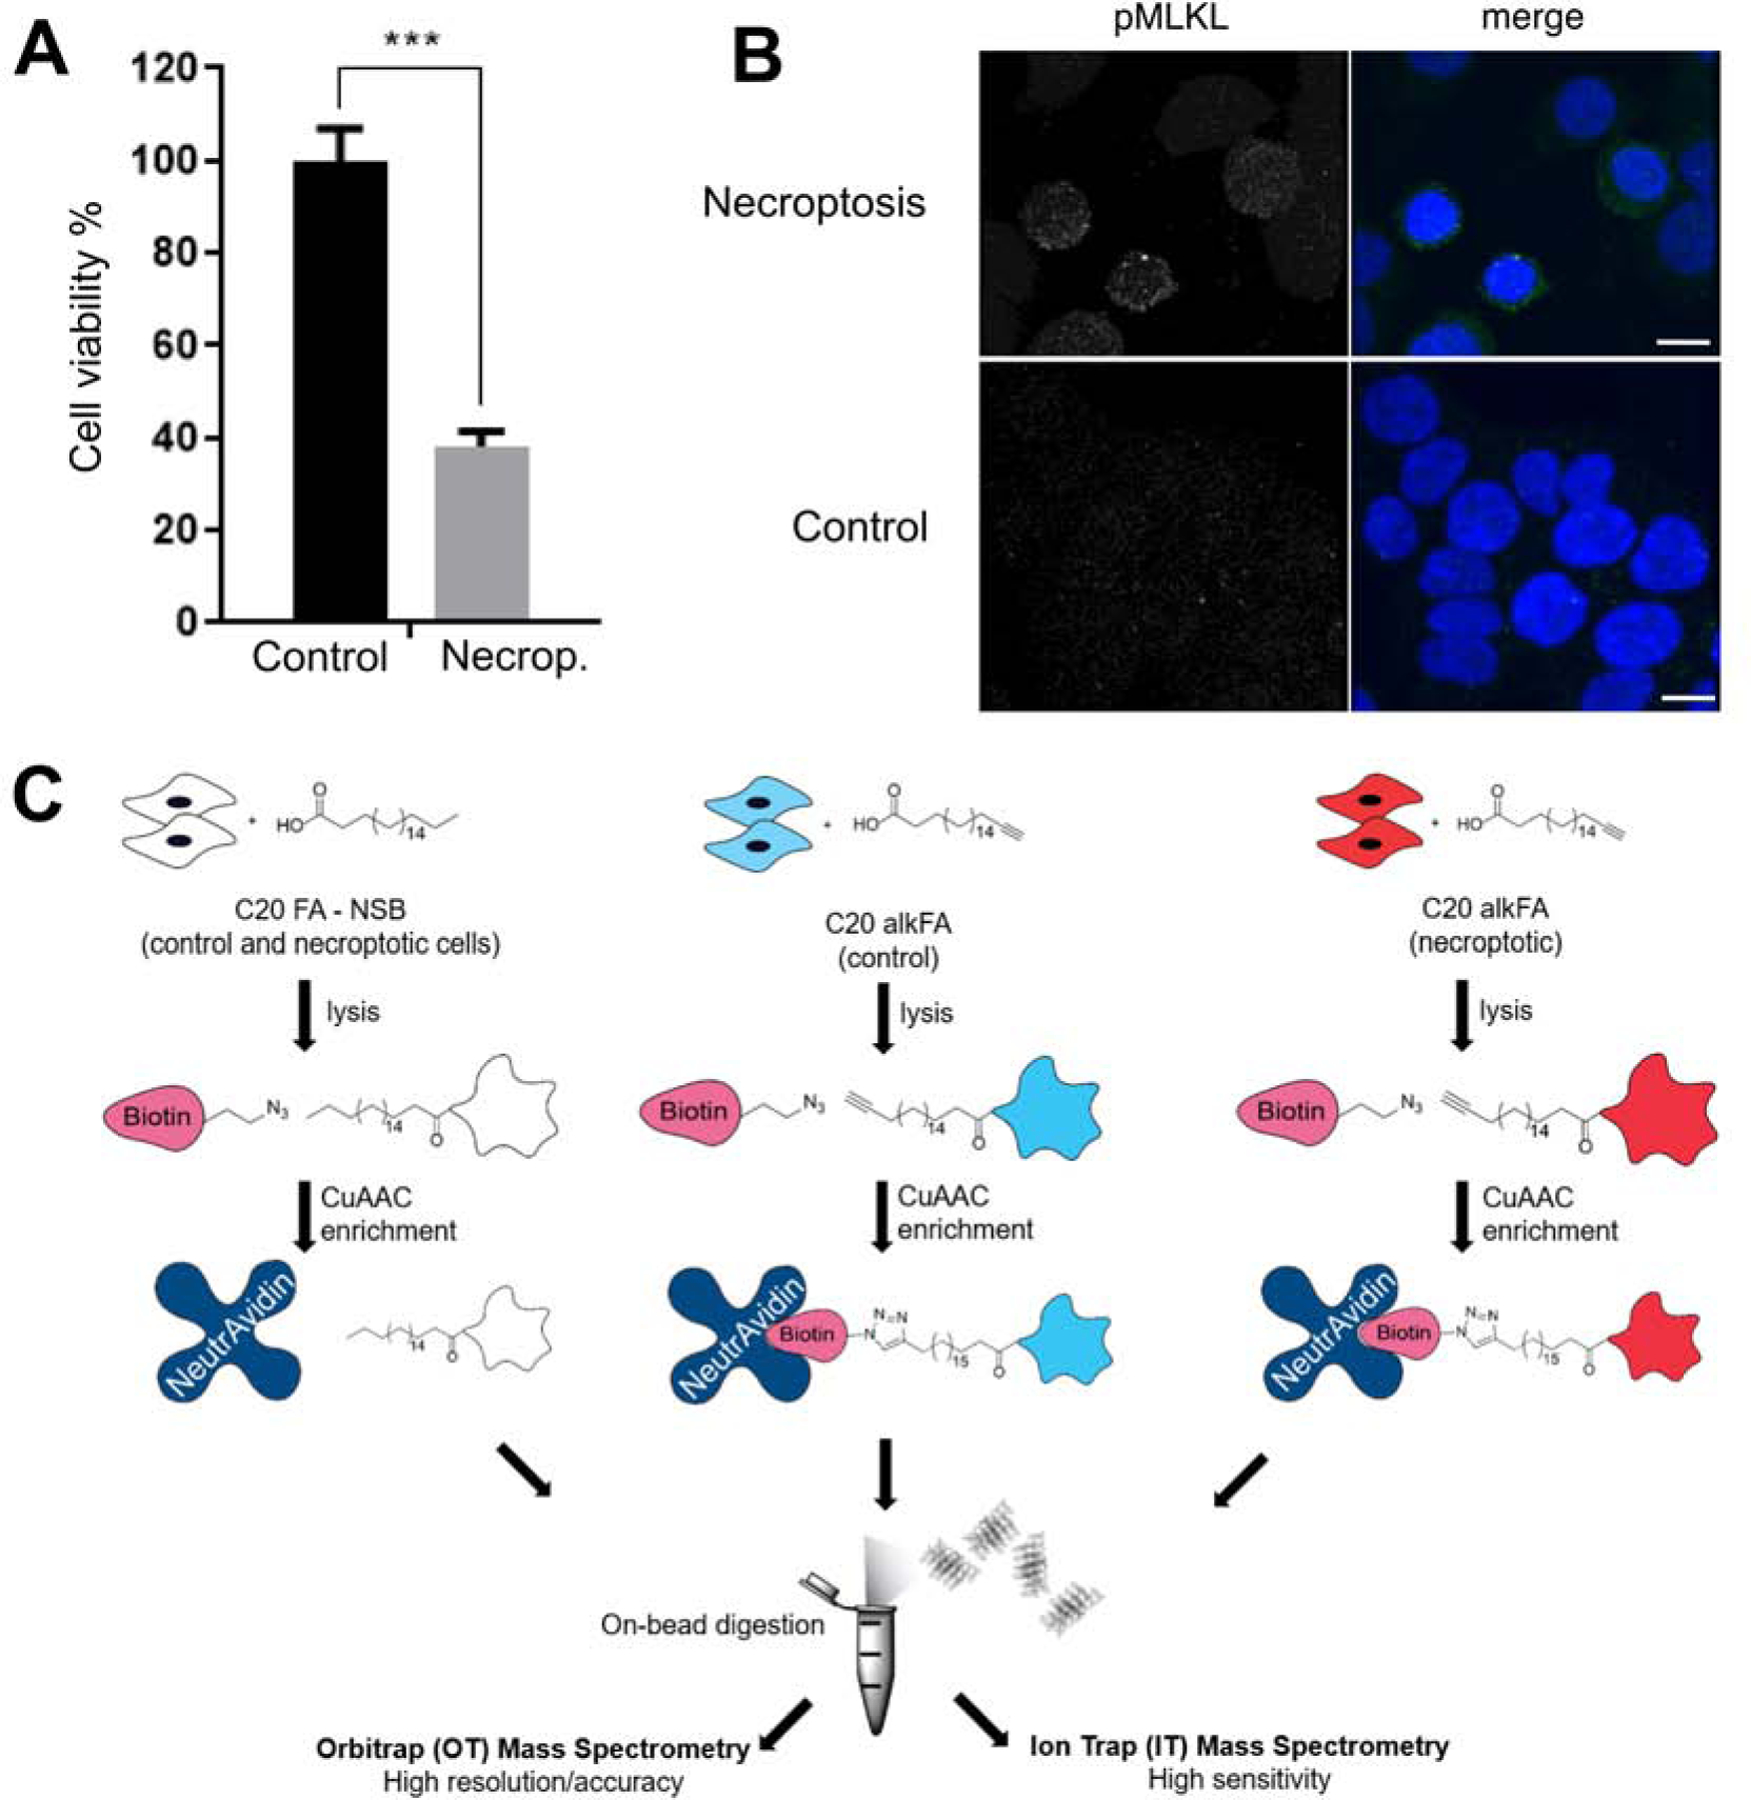
Figure 1. Induction of necroptosis and workflow of C20 fatty acid acylation and proteomics.

(A) Cell viability decreases as HT-29 cells undergo necroptosis. Necroptosis is induced with BV6/zVAD-FMK/TNF-α treatment. Data represent mean ± 1 SD; n=5. *** represents p < 0.001. (B) Cellular distribution of pMLKL during necroptosis. Sample 3D project images of pMLKL immunostaining in necroptotic (top) or control (bottom) cells show an increase in pMLKL staining, mainly concentrated at the plasma membrane. Merge images include DAPI nuclear staining (blue) and pMLKL (green). Scalebar represents 10 μm. (C) HT-29 cells were treated with endogenous C20:0 FA or C20:0 alkFA for 3h to account for non-specific and specific interactions respectively. Control and necroptotic cells were then membrane fractionated, subjected to CuAAC and installed with a biotin reporter. Biotinylated proteins were captured on neutravidin and subjected to on-bead trypsin digestion followed by quantitative proteomics. See also Figure S1.
