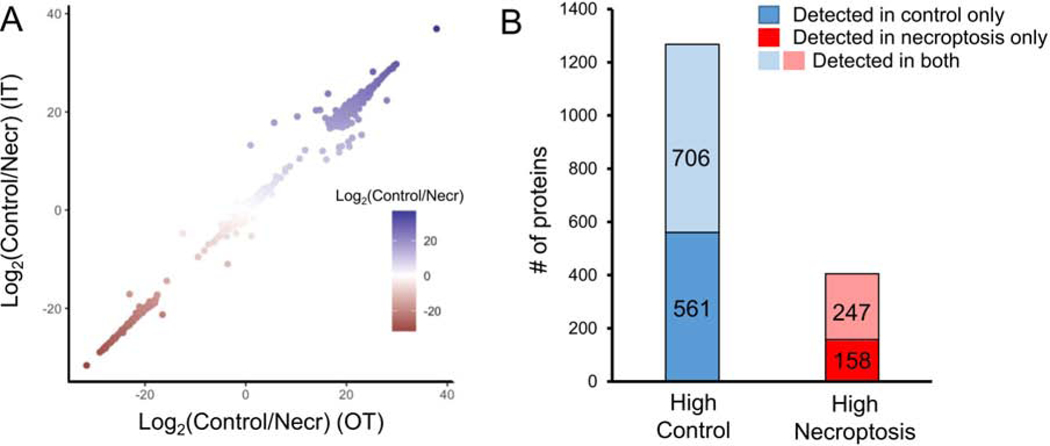
Figure 2. Quantitative analysis of acylated proteome in necroptosis.

(A) High correlation between the mean intensities of acylated proteins detected in control and necroptotic cells in Orbitrap Lumos (x axis) and Ion trap (y axis) platforms. Strong correlation between difference in mean intensities indicates biological variation rather than technical variation among the proteins detected in control and necroptotic cells. (B) Bar plot shows the total number of proteins (1672) undergoing acylation in either control, necroptotic or both conditions. Blue and red bars represent the number of proteins with high abundance in control or necroptotic cells, respectively. A higher number of proteins appear acylated in only control (561) as compared to only necroptosis (158). Overall, fewer proteins undergo acylation in necroptosis (405) as compared to control (1267). See also Figure S2 and Table S1.
