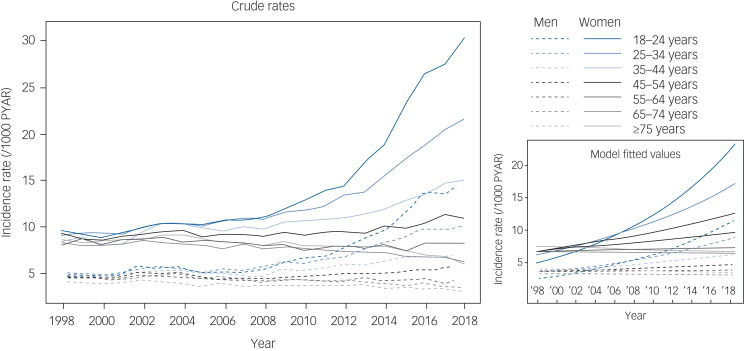
Fig. 1.
Recording of generalised anxiety diagnoses or symptoms by age group and gender. Annual incidence rates (left) for generalised anxiety diagnoses or symptoms were calculated by dividing the annual number of incident cases by the total person-years at risk (PYAR) for each year. Model fitted values (right) were calculated from a Poisson mixed effects model with a time smoother.

