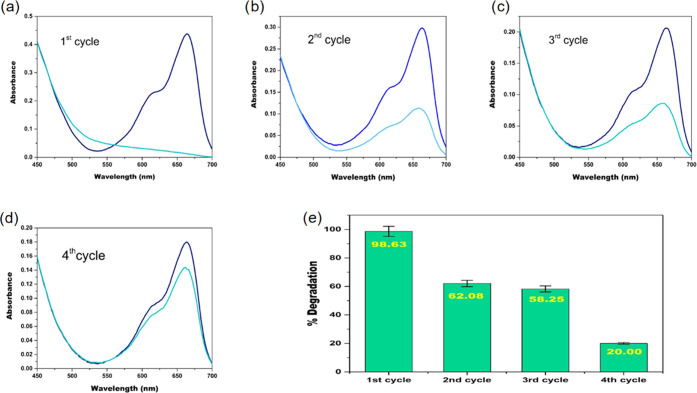
Figure 11.
(a–d) UV spectrum of MB before and after degradation in first, second, third, and fourth cycles, respectively. (e) Bar graph of four degradation cycles along with percentage degradation of MB in each cycle (pH = 6; [H2O2] = 19.4 mM (total cycles); [Cr(VI)] = 3 mM (total cycles); [MB] = 15.7 μM (per cycle); and temperature = 298 K).

