Abstract
An electronic textile-based NO2 gas sensor was fabricated using commercial silk and graphene oxide (GO). It showed a fast response time and excellent sensing performance, which was simply accomplished by modifying the heat-treatment process. The heat treatment was conducted at 400 °C and different heating rates of 1, 3, and 5 °C/min. Compared with our previous research, the response time significantly decreased, from 32.5 to 3.26 min, and we found that the highest response was obtained with the sensor treated at a heating rate of 1 °C/min. To find the reason for this enhanced sensing performance, the morphology, structure, and chemical composition of the reduced GO (rGO) were investigated, depending on the thermal treatment process, using scanning electron microscopy, X-ray diffraction, Raman spectroscopy, and X-ray photoelectron spectroscopy. We also measured the temperature-dependent resistance of rGO, which was well described by the fluctuation-induced tunneling (FIT) model. These results revealed that the rGO thermally treated with 1 °C/min of heating rate had the largest amount of oxygen groups. This means that the oxygen functional groups play an important role in NO2 gas-sensing performance.
Introduction
Materials for detecting harmful gases and bioresponses have been reported because of increased environmental pollution and interest in real-time health monitoring.1−7 Among them, graphene has been considered suitable for chemical sensors because it has a high surface area; hence, the absorption and desorption of gas molecules can easily occur.8,9 Schedin et al. reported that the conductivity of graphene was changed by charge transfer between graphene and gas molecules when it was exposed to NO2, NH3, H2O, and CO.10 However, because the mass production of graphene is difficult, graphene is not suitable for large-scale sensor applications.11−13 Graphene oxide (GO), one of the graphene-based materials, can be mass-produced using Hummers’ method and has been used for many applications because of the characteristics provided by the oxygen functional groups.14,15 To function as a chemoresistive sensor, some of the oxygen in the GO must be removed through a chemical or thermal reduction process because the oxygen functional groups make GO insulating.16 Thermal reduction is believed to be a more promising approach than chemical reduction because chemical reduction is a complicated process, and chemical agents are required.17−19 Moreover, the reduction method often generates heteroatomic impurities in the reduced graphene oxide (rGO). By contrast, thermal reduction is a very simple process.20−22 It avoids the use of a liquid environment that leads to uncontrollable aggregation, and no heteroatomic impurities are produced.23
The heating rate is an important factor when GO is reduced by the thermal reduction process. The oxygen functional groups are decomposed by heating. Huang et al. reported the self-propagating domino-like reduction.24 They found that the reduction of neighboring sites occurred because of exothermic thermal reaction. Moreover, Yang et al. reported that the deoxygenating reaction depended on the function of the heating rate, and the total amount of heat generated by the deoxygenating reaction increased with the heating rate.25 This shows that the degree of reduction changes with the heating rate. The oxygen functional groups remaining after thermal reduction play an important role in response to chemical molecules. Choi et al. theoretically determined that the response and recovery of graphene-based sensors to NO2 gas were closely related to the amount of oxygen functional groups, especially C–O bonding.26 In addition, they showed that hydroxyl groups were important active sites using first-principles calculations. For these reasons, further study of the degree of reduction in relation to the heating rate is essential to understanding the sensing mechanism between NO2 gas and thermally reduced rGO.
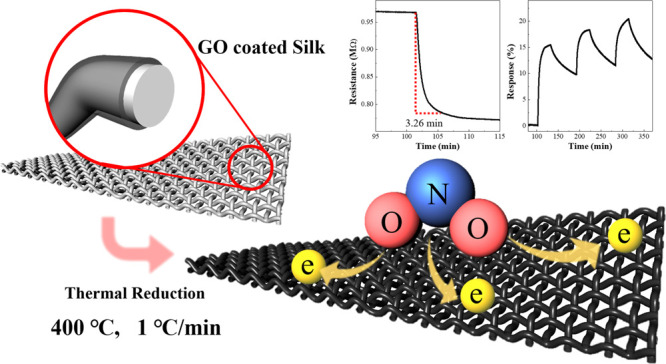
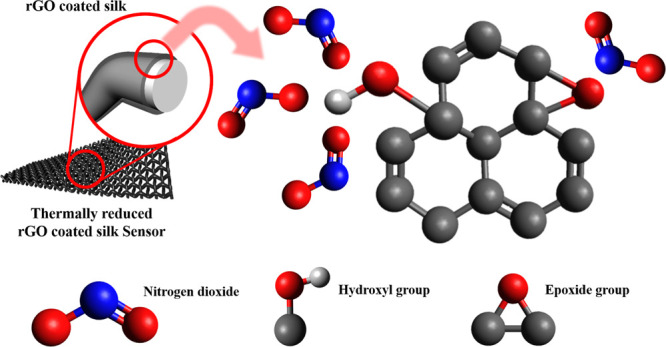
In a previous study, we fabricated an electronic textile (e-textile)-based NO2 gas sensor using commercial silk fabrics and GO.27 The response of the sensor made using satin (rGO-Sa) was 10.2% when it was thermally reduced at 400 °C. To improve the gas-sensing performance, we fabricated the sensor while modifying the thermal reduction process. The gas-sensing properties of the e-textile sensors were then investigated by exposing them to 1, 5, and 10 ppm of NO2 gas at room temperature. The sensor reduced at 400 °C with 1 °C/min of heating rate shows the best performance to NO2 gas. The response to 10 ppm of NO2 was 20.4%, which is 10.2% higher than that reported in the previous study. Moreover, the response time at 1 ppm of NO2 was significantly reduced, from 32.5 to 3.26 min. Also, we confirmed that the rGO thermally treated at 1 °C/min of heating rate had the largest amount of oxygen functional groups. For this reason, it is supposed that the gas-sensing performance of the rGO-based sensor is closely related to the amount of oxygen functional groups (Scheme 1), as theoretically reported.26
Scheme 1. Schematic Illustration for the rGO-Sa NO2 Gas Sensor.
Results and Discussion
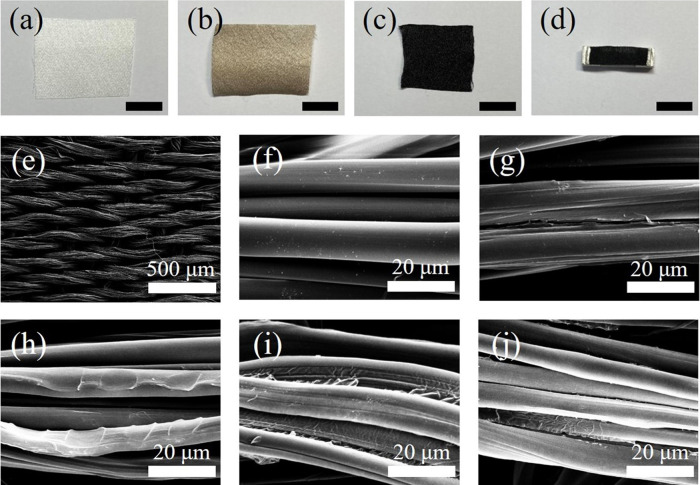
Figure 1a shows an optical image of white satin. After dipping in the GO solution, the GO is easily coated on the surface of the silk fabric by hydrogen bonding between the oxygen functional groups of the GO and silk fibroin proteins and by hydrophobic interactions between the GO and crystalline β-sheets. As a result, the color of satin changes from white to brown (Figure 1b). When it was heated at 400 °C, the structure was not destroyed, even though the fabric shrunk a little (Figure 1c,h–j). For the experiment of response to NO2 gas, we fabricated rGOn-Sa whose size is about 2.0 cm × 0.5 cm (Figure 1d).
Figure 1.
Optical images of (a) pristine satin, (b) GO-coated satin, (c) rGOn-Sa, and (d) the rGOn-Sa sensor (scale bar: 1 cm). SEM images of (e) satin fabric, (f) silk fibers of pristine satin, (g) GO-coated satin, (h) rGO1-Sa, (i) rGO3-Sa, and (j) rGO5-Sa.
Figure 1e shows the scanning electron microscopy (SEM) image of a satin fabric. The fiber of the pristine satin has a smooth surface (Figure 1f). After GO coating, the wrinkles were found on the surface of the fiber. It means GO is well coated without any chemical agent (Figure 1g). Moreover, GO remained on the fabric after heat treatment at 400 °C with 1, 3, and 5 °C/min heating rate (Figures 1h–j).
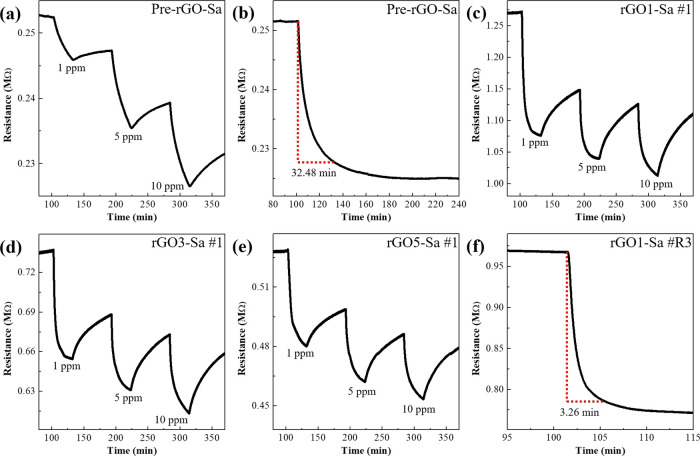
A noticeable difference in the NO2 gas-sensing response was observed in rGOn-Sa (n = 1, 3, and 5) compared with that of Pre-rGO-Sa. Figure 2 shows the variation in the resistance of the sensors when they were exposed to 1, 5, and 10 ppm of NO2 gas. The resistance change in Pre-rGO-Sa to 1 ppm of NO2 gas occurred very slowly, and it did not reach the steady-state response before 30 min (Figure 2a). The response time of the Pre-rGO-Sa was 32.48 min (Figure 2b). In contrast, the resistance of the rGOn-Sa samples decreased rapidly as soon as NO2 gas flowed and reached a steady-state response in much less than 10 min (Figures 2c–e). Here, we obtained response time using rGO1-Sa, which showed the highest sensing response. Note that rGO1-Sa has a remarkably short response time, whose average value is 5.60 min for three samples of rGO1-Sa #R1, #R2, and #R3 (7.16, 6.38, and 3.26 min, respectively). Figure 2f shows the shortest response time obtained with rGO1-Sa #R3.
Figure 2.
Resistance variation in (a) Pre-rGO-Sa exposed to 1, 5, and 10 ppm NO2 gas; (b) response time of Pre-rGO-Sa under 1 ppm of NO2 gas. Resistance variation in (c) rGO1-Sa #1, (d) rGO3-Sa #1, and (e) rGO5-Sa #1 samples exposed to 1, 5, and 10 ppm NO2 gas. (f) Response time of rGO1-Sa #R3 under 1 ppm of NO2 gas.
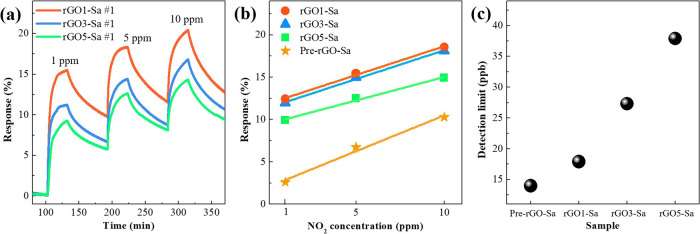
Figure 3a shows the NO2 gas-sensing response of the rGOn-Sa samples. We found that the heating rate affected the gas-sensing response of the rGOn-Sa. The best sensing response was exhibited by rGO1-Sa thermally treated at heating of 1 °C/min. The response decreased when the heating rate was higher than 1 °C/min. To confirm this tendency, we measured the sensing response for nine different rGO1-, rGO3-, and rGO5-Sa samples (total 27 samples), and then, the values were averaged (Figure 3b). The highest sensing response was shown in rGO1-Sa, as expected. The maximum responses of rGO1-Sa at 1, 5, and 10 ppm of NO2 were 15.5, 18.4, and 20.4%, respectively. These values are 12.6, 11.7, and 10.2% improvement compared with those of Pre-rGO-Sa at each ppm. Moreover, the response to 1.0 ppm of NO2 gas is more significant than that of other rGO-based e-textile NO2 sensors (see Table S1 in the Supporting Information). In Figure 3b, the response has a linear relation with the concentration of NO2 gas. The sensitivities of sensors (slope) were 0.6820 for rGO1-Sa, 0.6809 for rGO3-Sa, and 0.5537 for rGO5-Sa, which shows the same tendency as the gas-sensing response. Although the sensitivity of Pre-rGO-Sa (0.8474) is higher than that of rGOn-Sa, the total response of rGOn-Sa is superior to the response of Pre-rGO-Sa.
Figure 3.
(a) NO2 gas-sensing response of rGOn-Sa #1 samples as a function of time. (b) Averaged (9 times) response of rGOn-Sa samples as a function of NO2 concentration. (c) Calculated DL using the sensor’s signal-processing performance.
Also, Pre-rGO-Sa had the lowest theoretical detection limit (DL), followed sequentially by rGO1-, rGO3-, and rGO5-Sa (Figure 3c). Despite having the topmost sensitivity and the lowest NO2 DL, the Pre-rGO-Sa had a disadvantage to sensing NO2 because of the long response time and poor gas-sensing performance.
In a previous study,27 we found that NO2 gas was mainly detected by the rGO, and not the silk fabric. The role of the silk fabric is to provide flexibility and a large surface area. Therefore, we focused on the properties of the rGO for NO2 gas-sensing performance. The gas-sensing property changed depending on the heating process and heating rate, even when all samples were thermally treated at the same temperature. It is expected that the heating process and heating rate have an effect on the amount of oxygen functional groups removed from the GO during the thermal reduction process.25,28
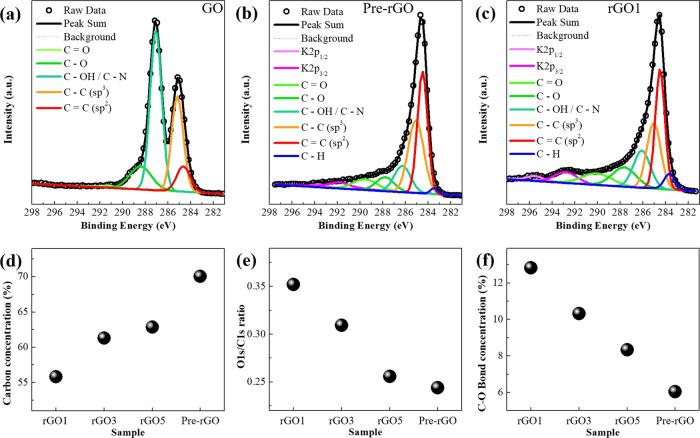
The X-ray photoelectron spectroscopy (XPS) C 1s region spectrum of the GO sheet showed that the C–C/C=C bonds accounted for 37.16%, and the rest were oxygen functional groups (Figure 4a). After thermal reduction, the proportion of C–C/C=C bonds increased because the oxygen components were removed due to thermal energy. (Figures 4b,c, and Figure S1 in the Supporting Information). It is worth noting that the degree of reduction was different, depending on the thermal treatment process (Figure 4d). The reason is that heat was also generated by deoxidization. The total heat applied to the GO includes not only external heat from the tube furnace but also heat from the exothermic thermal reaction, generated during the reduction process.24,25,28 Moreover, because the exothermic reaction depends on the heating rate, the amount of oxygen groups in rGO will be different. This is very important when designing rGO-based NO2 gas sensors because the oxygen functional groups act as the active sites, as mentioned above.26 It was reported that the hydroxyl groups in the rGO are mainly responsible for enhancing the gas-sensing performance because they have the shortest binding distance and the highest binding energy compared to any other oxygen group.
Figure 4.
XPS C 1s spectra of (a) GO, (b) Pre-rGO, and (c) rGO1. (d) C–C (sp3) and C=C (sp2) bond concentrations. (e) Ratio of O 1s to the C 1s. (f) C–O bond concentration of each sample.
The worst sensing performance was exhibited by the Pre-rGO, which had the highest proportion of C–C/C=C bonds (70.05%). rGO1 (1 means the heating rate 1 °C/min), which showed the best sensing performance, had the lowest C–C/C=C bonds (55.76%). On the other hand, the lowest ratio of oxygen to carbon (0.244) was observed in Pre-rGO, but the highest ratio (0.352) was exhibited in rGO1 (Figure 4e). The same tendency was found in the amount of C–O bonds, which is closely related to hydroxyl groups. Pre-rGO had the lowest amount of C–O bond (6.04%), but the rGO1 had the highest proportion of C–O bonds (12.82%, Figure 4f). This indicates that the amount of oxygen functional groups, especially C–O bonds, is directly concerned in the NO2 gas-sensing performance.
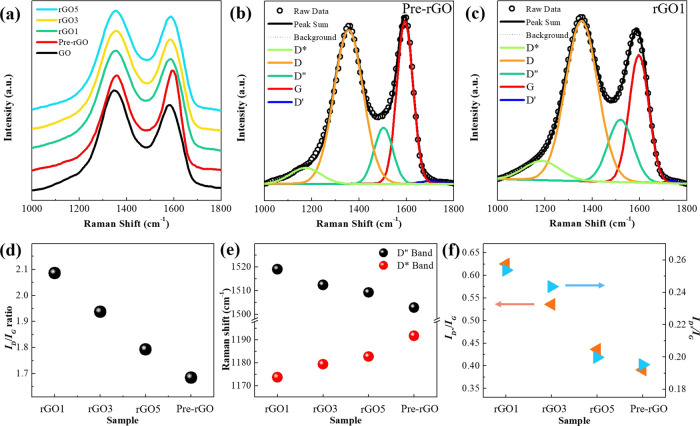
These results and tendencies were also observed in the Raman spectra. The D band and G band appeared at ∼1350 and ∼1586 cm–1 in all the rGO samples, respectively (Figure 5a).
Figure 5.
(a) Raman spectra of GO and rGO samples. The fitted Raman spectra of (b) Pre-rGO and (c) rGO1 by five bands (D*, D, D″, G, and D′). (d) Variation in the ID/IG ratio. (e) Raman shift of the D″ band (black circle) and D* band (red circle). (f) Ratio of ID″/IG (leftward red triangle) and ID*/IG (rightward blue triangle).
The G band represents the band stretching of sp2 carbon, and the D band is related to defects and disorders in the carbon structure.29 The ID/IG ratio, which is calculated from the subpeak fitting results (Figures 5b,c, and S2 in the Supporting Information), is 2.085 and 1.685 for rGO1 and Pre-rGO, respectively. These two ID/IG ratios are the highest and the lowest values among the samples. The ID/IG ratio of rGO3 and rGO5 follows the same tendency as the NO2 gas-sensing result (Figure 5d). The Raman spectra of GO also had other bands, the D*, D″, and D′ bands, as shown in Figures 5b,c, and S2 in the Supporting Information.30,31 The D* band appears between 1150 and 1200 cm–1 in the disordered graphitic lattice of soot because of the sp3 bonds. The D″ band between 1480 and 1500 cm–1 is related to the amorphous phase. Also, the D′ band at ∼1620 cm–1 is due to disordered-induced phonons caused by crystal defects. The D* and D″ peaks in particular can be used as a criterion for the degree of reduction because they change depending on the amount of oxygen functional groups. When the number of oxygen functional groups decrease, the Raman shift of the D* band increases, but that of the D″ band decreases. Figure 5e shows that the Pre-rGO has the largest D* band Raman shift of 1191.78 cm–1, and the rGO1 has the smallest wavenumber (1173.59 cm–1). Also, the D″ band has the opposite tendency to the D* band. The maximum ID″/IG and ID*/IG ratios were also observed in rGO1 (Figure 5f). The results of the Raman spectra showed that the degree of reduction in rGO1 was lower than that in any other samples. This indicates that many more oxygen functional groups exist in the rGO1 compared with the other rGOs, which is consistent with the XPS results.
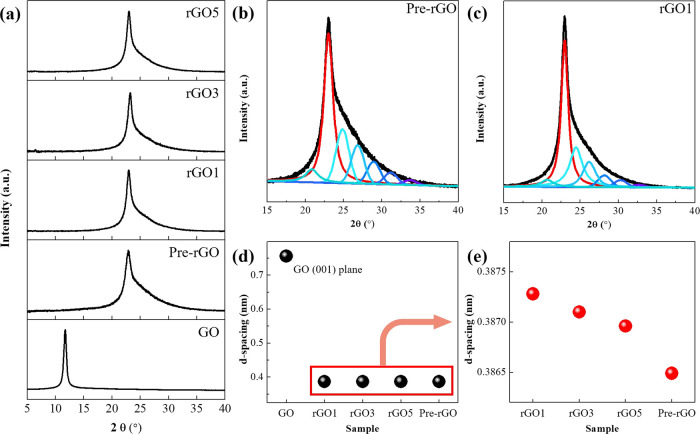
In the X-ray diffraction (XRD) study, the peak at 2θ = 11.71 ° in GO indicates the (001) lattice plane of the sp2-hybridized carbon hexagonal structure, and the interlayer distance is 0.756 nm (Figures 6a,c).32 After the thermal reduction process, the interlayer distance decreases because of the decrease in oxygen groups. As a result, the peak position moves to higher 2θ (Figure 6a). In the rGO samples, the peak for the (002) lattice plane can be divided into multiple peaks. This means that the (002) lattice plane is overlapped with various amorphous structures (Figures 6b,c, and S3 in the Supporting Information). Among the rGOn samples, the maximum and minimum interlayer distances calculated from the main peak were observed in rGO1 and Pre-rGO, respectively (Figures 6d,e). This means that the rGO1 has the highest proportion of oxygen functional groups after thermal reduction among rGO samples.
Figure 6.
(a) XRD patterns of GO and rGO samples. The amorphous structure overlapped the (002) lattice plane of (b) Pre-rGO and (c) rGO1. The interlayer distance of samples (d) with the GO (001) plane and (e) without the GO (001) plane.
The structure of rGO can be considered as randomly distributed heteroatom (oxygen functional groups)-embedded carbon substrates. Hence, rGO consists of the carbon domain (conducting region) separated by oxygen functional groups (insulating region) that act as a potential barrier. It indicates that the potential barrier width (w) becomes larger as the amount of oxygen functional groups increases. In this case, tunneling and overcoming the barrier of charge carriers are inevitable. The fluctuation-induced tunneling (FIT) model describes this behavior well, as follows:33
where R is resistance and T is temperature. T0 is the temperature at which the electron starts to become thermally activated, and T1 is the energy required for the electron to overcome the insulating gap between carbon clusters. T0 and T1 are described as follows:34
where ℏ is Plank’s constant, m is the mass of the electron, e is the electronic charge, kb is the Boltzmann constant, ε0 is the permittivity of vacuum, A is the junction area, V0 is potential height, and w is potential width. T1/T0 is described as follows:
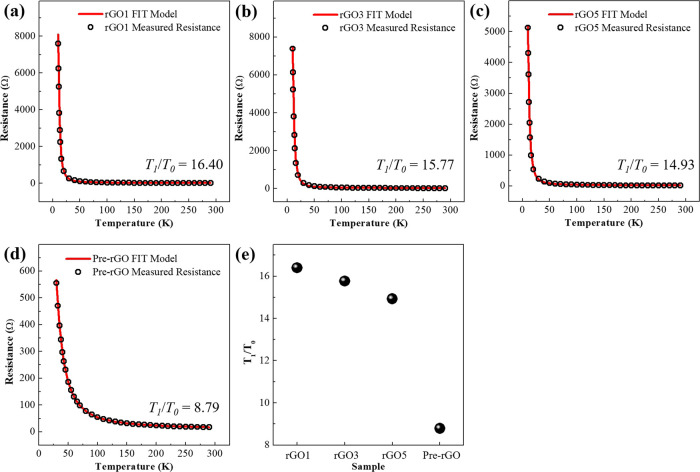
It is related to the potential barrier (w and V0) that comes from the oxygen functional groups. Hence, T1/T0 provides information about the amount of oxygen functional groups. Figure 7a–e shows the temperature-dependent resistance and T1/T0 values analyzed using the FIT model. T1/T0 values are 16.40 for rGO1, 15.77 for rGO3, 14.93 for rGO5, and 8.79 for Pre-rGO. This behavior shows that the charge-transport property also explains the gas-sensing performance of rGOn-Sa well. As a result, it is confirmed that the NO2 gas-sensing performance and response time depend on the amount of oxygen functional groups in rGO.
Figure 7.
Temperature-dependent resistance (black circles) and the fitted FIT model (red line) of (a) rGO1, (b) rGO3, (c) rGO5, and (d) Pre-rGO. (e) T1/T0 value of the samples.
Finally, because the surface area and pore structure can also affect the gas-sensing response, we obtained them by Brunauer–Emmett–Teller (BET) analysis and the t-plot using N2 sorption isotherm (Figure S4 in the Supporting Information). The BET surface areas are 13.1 m2/g for rGO1, 13.2 m2/g for rGO3, and 12.8 m2/g for rGO5. Micropore volumes of rGOn (n = 1, 3, and 5) are 0.0018, 0.0022, and 0.0018 cm3/g, respectively. These results show that the sensing response of rGOn-Sa is not related to the surface area and pore volume.
Conclusions
We fabricated an e-textile-based NO2 gas sensor using commercial silk and GO by thermal reduction with different heating rates. Compared with our previous study, the response time decreased, and the gas-sensing response increased. In particular, the response of the rGO1-Sa was 20.4% at 10 ppm of NO2, which was the best gas-sensing performance of any sample. We found that the difference in gas-sensing performance was due to the amount of oxygen functional groups. In other words, the amount of oxygen groups is closely related to the enhanced gas-sensing performance. These results were confirmed by XPS, Raman spectra, XRD, and charge-transport properties described by the FIT model. In this study, we confirmed that the amount of oxygen functional groups changes depending on the heating rate, which affects the gas-sensing property. We suggest that it is possible to improve the gas-sensing performance of rGO-coated materials by controlling the amount of oxygen groups.
Materials and Methods
Synthesis of GO Sheets and rGO
GO was synthesized using Hummers’ method using graphite powder (99.9995% metals basis, Alfa Aesar).12 To prepare the rGO sheet, heat treatment was conducted at 400 °C using the previously reported thermal reduction process (Pre-rGO)27 and different heating rates: 1 °C/min (rGO1), 3 °C/min (rGO3), and 5 °C/min (rGO5).
Preparation of rGO-Sa
GO was dissolved in deionized (DI) water and sonicated for 3 h to make a 1 mg/mL GO solution. Then, the satin, a type of commercial silk fabric, was dipped into the GO solution for 30 min and dried in a fume hood to coat the GO uniformly onto the satin. The samples were then heated to 400 °C at different heating rates of 1 °C/min (rGO1-Sa), 3 °C/min (rGO3-Sa), and 5 °C/min (rGO5-Sa) in the N2 atmosphere. After that, the temperature was maintained at 400 °C for 2 h.
Characterization
To observe the morphology of the samples, SEM (CX-200TM, COXEM, Daejeon, Korea) was used. XPS (PHI 5000 Versa Probe II, Ulvac-PHI 5000 VersaProbe, Phi(Φ), Chigasaki, Japan) was performed with an Al-Kα X-ray source at 23.1 W to analyze the oxygen components. The structure of the rGO sheet, depending on the heating rate, was determined by XRD (SmartLab, Rigaku, Tokyo, Japan) with Cu Kα radiation (λ = 1.5418 Å) with a range from 5° to 90°. Raman spectroscopy (Raman-LTPL system, Witec alpha300, Witec, Ulm, Germany) was performed using a 532 nm laser.
Measurement of the Temperature-Dependent Resistance of the rGO Sheets
The temperature-dependent resistance of the rGO sheets was measured using a conventional four-probe method. The sample was loaded into a closed-cycle refrigerator cryostat, and the cryostat was evacuated down to under 1 × 10⁻⁵ Torr. Then, we measured temperature-dependent resistance from 293 K to 8 K using a KEITHLEY 6211 direct current (DC) and an alternating current (AC) source, a 2182 nanovoltmeter (KEITHLEY Instruments, Ohio, USA), and a LakeShore 335 temperature controller (Lake Shore Cryotronics, Ohio, USA).
Gas-Sensing Measurements
NO2 gas-sensing measurements were performed on the rGOn-Sa using a KEITHLEY 6517A electrometer/high resistance meter and a KEITHLEY 7001 switch system (Keithley Instruments, Ohio, USA). We applied 1.0 V of bias voltage and measured the resistance of rGOn-Sa at 25 °C. A more detailed description was reported in the previous study.27 The sensor response was defined as S (%) = (Ra – Rg)/Ra × 100, where Ra and Rg are the resistance in air and NO2 gas, respectively. The sensor response of each sample (rGO1-, rGO3-, and rGO5-Sa) was measured nine times.
The response time and humidity dependency were measured under 1 ppm of NO2 using rGO1-Sa, which showed the highest NO2-sensing performance (Figure S5 in the Supporting Information). The response time of rGO1-Sa was defined as the time when the resistance reached 90% of the saturated resistance change after exposure to NO2 gas. Each experiment was measured nine times. The humidity was stepwise increased from 0% (∼2%) to 80% in 10% step.
The theoretical NO2 DL was calculated using the sensor’s signal-processing performance.26,35 For calculating the DL, we obtain the rms noise and slope of the sensor response. First, we choose 10 data points at the baseline before exposing the NO2 gas. Then, we carried out fifth-order polynomial fitting about the chosen data using the Origin program. Through the polynomial fitting, we obtain the yi – y value; yi is the original 10 points data value, and y is the fifth-order polynomial data value. Therefore, we can calculate Vχ2
and the rms noise
where N is the number of data we choose. To obtain the slope that indicates the sensitivity to NO2 gas, we draw the response graph. The x-axis is NO2 concentration and the y-axis is the response (Figure 3b). We obtained the slope by the linear fitting of the response graph. Using this value, we calculated the theoretical DL with the following equation:
Acknowledgments
This work was supported by the Basic Science Research Program through the National Research Foundation of Korea (NRF) funded by the Ministry of Education (NRF-2020R1A2C4001513) and Incheon National University Research Grant in 2020-0374.
Supporting Information Available
The Supporting Information is available free of charge at https://pubs.acs.org/doi/10.1021/acsomega.1c03658.
Table S1: Response of the rGO-based e-textile NO2 sensors, Figure S1: XPS C 1s spectra of rGO3 and rGO5, Figure S2: fitted Raman spectra of GO, rGO3, and rGO5, Figure S3: amorphous structure-overlapped (002) lattice plane of rGO3 and rGO5, Figure S4: N2 sorption isotherms of rGOn at 77 K, Figure S5: resistance and response of rGO1-Sa under humidity conditions (PDF)
Author Contributions
# W.T.J. and H.-S.J. contributed equally to this work.
The authors declare no competing financial interest.
Supplementary Material
References
- Su Y.; Xie G.; Tai H.; Li S.; Yang B.; Wang S.; Zhang Q.; Du H.; Zhang H.; Du X.; Jiang Y. Self-powered room temperature NO2 detection driven by triboelectric nanogenerator under UV illumination. Nano Energy 2018, 47, 316–324. 10.1016/j.nanoen.2018.02.031. [DOI] [Google Scholar]
- Su Y.; Yao M.; Xie G.; Pan H.; Yuan H.; Yang M.; Tai H.; Du X.; Jiang Y. Improving sensitivity of self-powered room temperature NO2 sensor by triboelectric-photoelectric coupling effect. Appl. Phys. Lett. 2019, 115, 073504 10.1063/1.5110334. [DOI] [Google Scholar]
- Wang S.; Jiang Y.; Tai H.; Liu B.; Duan Z.; Yuan Z.; Pan H.; Xie G.; Du X.; Su Y. An integrated flexible self-powered wearable respiration sensor. Nano Energy 2019, 63, 103829. 10.1016/j.nanoen.2019.06.025. [DOI] [Google Scholar]
- Su Y.; Yang T.; Zhao X.; Cai Z.; Chen G.; Yao M.; Chen K.; Bick M.; Wang J.; Li S.; Xie G.; Tai H.; Du X.; Jiang Y.; Chen J. A wireless energy transmission enabled wearable active acetone biosensor for non-invasive prediabetes diagnosis. Nano Energy 2020, 74, 104941 10.1016/j.nanoen.2020.104941. [DOI] [Google Scholar]
- Su Y.; Wang J.; Wang B.; Yang T.; Yang B.; Xie G.; Zhou Y.; Zhang S.; Tai H.; Cai Z.; Chen G.; Jiang Y.; Chen L.-Q.; Chen J. Alveolus-inspired active membrane sensors for self-powered wearable chemical sensing and breath analysis. ACS Nano 2020, 14, 6067–6075. 10.1021/acsnano.0c01804. [DOI] [PubMed] [Google Scholar]
- Su Y.; Chen G.; Chen C.; Gong Q.; Xie G.; Yao M.; Tai H.; Jiang Y.; Chen J. Self-powered respiration monitoring enabled by a triboelectric nanogenerator. Adv. Mater. 2021, 33, 2101262 10.1002/adma.202101262. [DOI] [PubMed] [Google Scholar]
- Fan W.; He Q.; Meng K.; Tan X.; Zhou Z.; Zhang G.; Yang J.; Wang Z. L. Machine-knitted washable sensor array textile for precise epidermal physiological signal monitoring. Sci. Adv. 2020, 6, 2840. 10.1126/sciadv.aay2840. [DOI] [PMC free article] [PubMed] [Google Scholar]
- Dan Y.; Lu Y.; Kybert N. J.; Luo Z.; Johnson A. C. Intrinsic response of graphene vapor sensors. Nano Lett. 2009, 9, 1472–1475. 10.1021/nl8033637. [DOI] [PubMed] [Google Scholar]
- Basu S.; Bhattacharyya P. Recent developments on graphene and graphene oxide based solid state gas sensors. Sens. Actuators, B 2012, 173, 1–21. 10.1016/j.snb.2012.07.092. [DOI] [Google Scholar]
- Schedin F.; Geim A. K.; Morozov S. V.; Hill E. W.; Blake P.; Katsnelson M. I.; Novoselov K. S. Detection of individual gas molecules adsorbed on graphene. Nat. Mater. 2007, 6, 652–655. 10.1038/nmat1967. [DOI] [PubMed] [Google Scholar]
- Zhi L.; Müllen K. A bottom-up approach from molecular nanographenes to unconventional carbon materials. J. Mater. Chem. 2008, 18, 1472–1484. 10.1039/b717585j. [DOI] [Google Scholar]
- Zhang X.; Wang L.; Xin J.; Yakobson B. I.; Ding F. Role of hydrogen in graphene chemical vapor deposition growth on a copper surface. J. Am. Chem. Soc. 2014, 136, 3040–3047. 10.1021/ja405499x. [DOI] [PubMed] [Google Scholar]
- Shim H. W.; Ahn K.-J.; Im K.; Noh S.; Kim M.-S.; Lee Y.; Choi H.; Yoon H. Effect of hydrophobic moieties in water-soluble polymers on physical exfoliation of graphene. Macromolecules 2015, 48, 6628–6637. 10.1021/acs.macromol.5b01423. [DOI] [Google Scholar]
- Hummers W. S. Jr.; Offeman R. E. Preparation of graphitic oxide. J. Am. Chem. Soc. 1958, 80, 1339–1339. 10.1021/ja01539a017. [DOI] [Google Scholar]
- Guerrero-Contreras J.; Caballero-Briones F. Graphene oxide powders with different oxidation degree, prepared by synthesis variations of the Hummers method. Mater. Chem. Phys. 2015, 153, 209–220. 10.1016/j.matchemphys.2015.01.005. [DOI] [Google Scholar]
- Yan J. A.; Chou M. Y. Oxidation functional groups on graphene: Structural and electronic properties. Phys. Rev. B 2010, 82, 125403 10.1103/PhysRevB.82.125403. [DOI] [Google Scholar]
- Zhang J.; Yang H.; Shen G.; Cheng P.; Zhang J.; Guo S. Reduction of graphene oxide via L-ascorbic acid. Chem. Commun. 2010, 46, 1112–1114. 10.1039/B917705A. [DOI] [PubMed] [Google Scholar]
- Ma H.-L.; Zhang Y.; Hu Q.-H.; Yan D.; Yu Z.-Z.; Zhai M. Chemical reduction and removal of Cr(VI) from acidic aqueous solution by ethylenediamine-reduced graphene oxide. J. Mater. Chem. 2012, 22, 5914–5916. 10.1039/c2jm00145d. [DOI] [Google Scholar]
- De Silva K. K. H.; Huang H.-H.; Joshi R. K.; Yoshimura M. Chemical reduction of graphene oxide using green reductants. Carbon 2017, 119, 190–199. 10.1016/j.carbon.2017.04.025. [DOI] [Google Scholar]
- Kumar P. V.; Bardhan N. M.; Chen G.-Y.; Li Z.; Belcher A. M.; Grossman J. C. New insights into the thermal reduction of graphene oxide: Impact of oxygen clustering. Carbon 2016, 100, 90–98. 10.1016/j.carbon.2015.12.087. [DOI] [Google Scholar]
- Acik M.; Lee G.; Mattevi C.; Pirkle A.; Wallace R. M.; Chhowalla M.; Cho K.; Chabal Y. The role of oxygen during thermal reduction of graphene oxide studied by infrared absorption spectroscopy. J. Phys. Chem. C 2011, 115, 19761–19781. 10.1021/jp2052618. [DOI] [Google Scholar]
- Zhang C.; Lv W.; Xie X.; Tang D.; Liu C.; Yang Q.-H. Towards low temperature thermal exfoliation of graphite oxide for graphene production. Carbon 2013, 62, 11–24. 10.1016/j.carbon.2013.05.033. [DOI] [Google Scholar]
- McAllister M. J.; Li J.-L.; Adamson D. H.; Schniepp H. C.; Abdala A. A.; Liu J.; Herrera-Alonso M.; Milius D. L.; Car R.; Prud’homme R. K.; Aksay I. A. Single sheet functionalized graphene by oxidation and thermal expansion of graphite. Chem. Mater. 2007, 19, 4396–4404. 10.1021/cm0630800. [DOI] [Google Scholar]
- Kim F.; Luo J.; Cruz-Silva R.; Cote L. J.; Sohn K.; Huang J. Self-propagating domino-like reactions in oxidized graphite. Adv. Funct. Mater. 2010, 20, 2867–2873. 10.1002/adfm.201000736. [DOI] [Google Scholar]
- Yang S. J.; Kim T.; Jung H.; Park C. R. The effect of heating rate on porosity production during the low temperature reduction of graphite oxide. Carbon 2013, 53, 73–80. 10.1016/j.carbon.2012.10.032. [DOI] [Google Scholar]
- Choi Y. R.; Yoon Y.-G.; Choi K. S.; Kang J. H.; Shim Y.-S.; Kim Y. H.; Chang H. J.; Lee J.-H.; Park C. R.; Kim S. Y.; Jang H. W. Role of oxygen functional groups in graphene oxide for reversible room-temperature NO2 sensing. Carbon 2015, 91, 178–187. 10.1016/j.carbon.2015.04.082. [DOI] [Google Scholar]
- Jung W. T.; Jeon J. W.; Jang H.-S.; Kim D. Y.; Lee H.-K.; Kim B. H. Commercial silk-based electronic textiles for NO2 sensing. Sens. Actuators, B 2020, 307, 127596 10.1016/j.snb.2019.127596. [DOI] [Google Scholar]
- Qiu Y.; Guo F.; Hurt R.; Külaots I. Explosive thermal reduction of graphene oxide-based materials: mechanism and safety implications. Carbon 2014, 72, 215–223. 10.1016/j.carbon.2014.02.005. [DOI] [PMC free article] [PubMed] [Google Scholar]
- Malard L. M.; Pimenta M. A.; Dresselhaus G.; Dresselhaus M. S. Raman spectroscopy in graphene. Phys. Rep. 2009, 473, 51–87. 10.1016/j.physrep.2009.02.003. [DOI] [Google Scholar]
- López-Díaz D.; López Holgado M.; García-Fierro J. L.; Velázquez M. M. Evolution of the Raman spectrum with the chemical composition of graphene oxide. J. Phys. Chem. C 2017, 121, 20489–20497. 10.1021/acs.jpcc.7b06236. [DOI] [Google Scholar]
- Claramunt S.; Varea A.; López-Díaz D.; Velázquez M. M.; Cornet A.; Cirera A. The importance of interbands on the interpretation of the Raman spectrum of graphene oxide. J. Phys. Chem. C 2015, 119, 10123–10129. 10.1021/acs.jpcc.5b01590. [DOI] [Google Scholar]
- Stobinski L.; Lesiak B.; Malolepszy A.; Mazurkiewicz M.; Mierzwa B.; Zemek J.; Jiricek P.; Bieloshapka I. Graphene oxide and reduced graphene oxide studied by the XRD, TEM and electron spectroscopy methods. J. Electron Spectrosc. Relat. Phenom. 2014, 195, 145–154. 10.1016/j.elspec.2014.07.003. [DOI] [Google Scholar]
- Sheng P. Fluctuation-induced tunneling conduction in disordered materials. Phys. Rev. B 1980, 21, 2180. 10.1103/PhysRevB.21.2180. [DOI] [Google Scholar]
- Lin Y.-H.; Chiu S.-P.; Lin J.-J. Thermal fluctuation-induced tunneling conduction through metal nanowire contacts. Nanotechnology 2008, 19, 365201 10.1088/0957-4484/19/36/365201. [DOI] [PubMed] [Google Scholar]
- Li J.; Lu Y.; Ye Q.; Cinke M.; Han J.; Meyyappan M. Carbon nanotube sensors for gas and organic vapor detection. Nano Lett. 2003, 3, 929–933. 10.1021/nl034220x. [DOI] [Google Scholar]
Associated Data
This section collects any data citations, data availability statements, or supplementary materials included in this article.


