Figure 1.

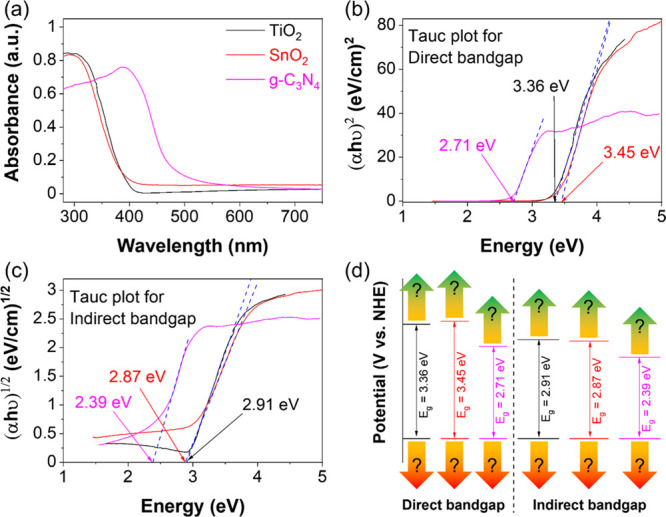
DRS spectra (a). Tauc plots of (αhν)2 vs energy (b) and (αhν)1/2 vs energy (c) of TiO2, SnO2, and g-C3N4. Direct and indirect band gaps of materials (d). DRS spectra cannot determine the positions of the CB and VB of materials.

DRS spectra (a). Tauc plots of (αhν)2 vs energy (b) and (αhν)1/2 vs energy (c) of TiO2, SnO2, and g-C3N4. Direct and indirect band gaps of materials (d). DRS spectra cannot determine the positions of the CB and VB of materials.