
Figure 8.
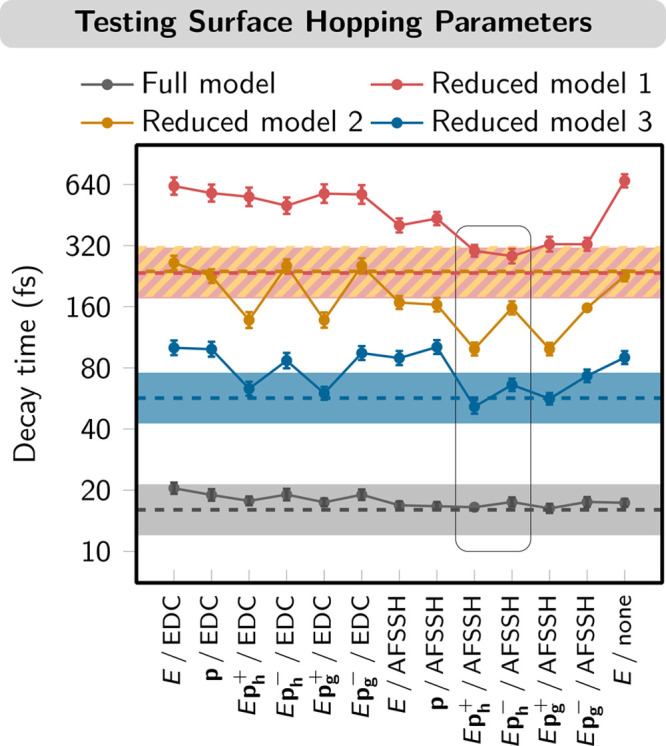
Comparison of decay time constants obtained for four different LVC models of [Re(CO)3(im)(phen)]+ (im = imidazole; phen = phenanthroline). Fitted decay time constants from MCTDH/LVC are shown as dashed lines (shaded areas indicate acceptable error intervals). It should be noted that the results of models 1 and 2 deliver almost identical decay times and errors (brown/orange superimposed dashed lines and hatched pattern). The fitted decay times and standard errors of SH/LVC simulations with 13 different settings (see the text) are given as colored dots and error bars, respectively. The best-performing protocols are indicated by the box. Data were taken from ref (3).