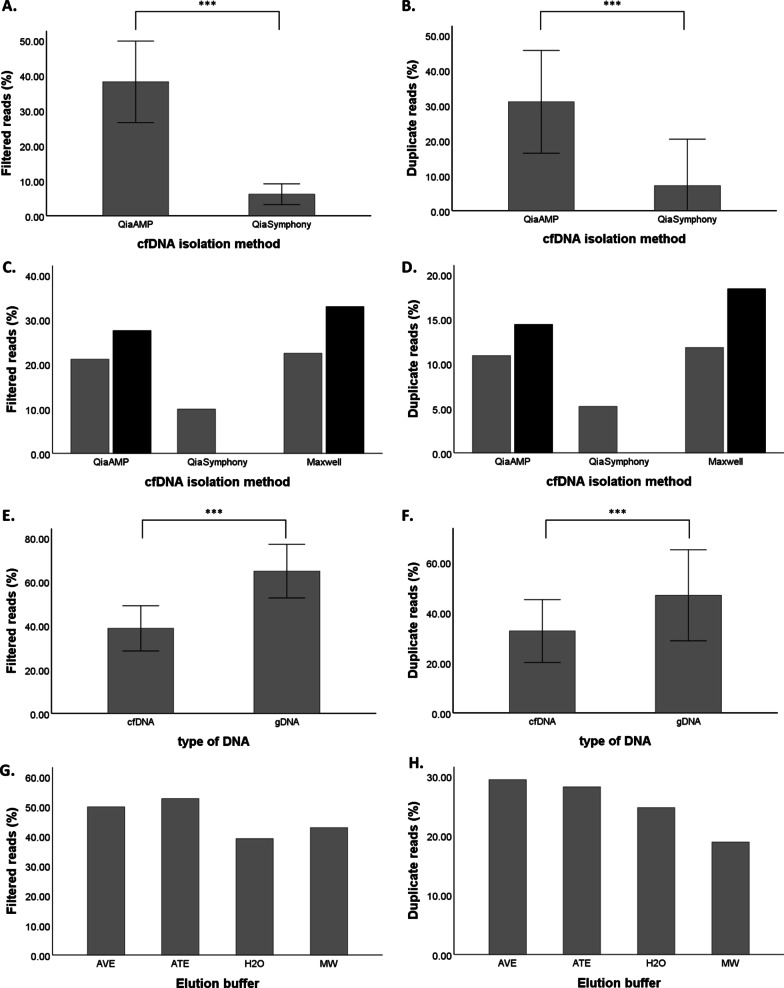
Fig. 3.
The compatibility of different isolation methods with MeD-seq analysis. In A and B, percentages of LpnPI filtered reads and duplicate reads are shown for QIAamp (n = 45) and QiaSymphony (n = 37) isolated cfDNA samples. In C and D, filtered reads and duplicate reads are shown of cfDNA isolated from aliquots of the same plasma from patients M12 (black) and M69 (grey) by QIAamp, QiaSymphony, and Maxwell. In E and F, a significantly lower percentage of filtered and duplicate reads is shown for cfDNA compared to gDNA samples. In G and H, filtered reads and duplicate reads are shown for genomic MCF7 DNA in the different elution buffers. ***: p ≤ 0.001, AVE buffer (QIAamp): RNase-free water with 0.04% NaN3; ATE buffer (QiaSymphony): 10 mM Tris–HCl pH 8.3, 0.1 mM EDTA, and 0.04% NaN3; MW buffer (Maxwell): 10 mM Tris, 0.1 mM EDTA, pH 9.0

