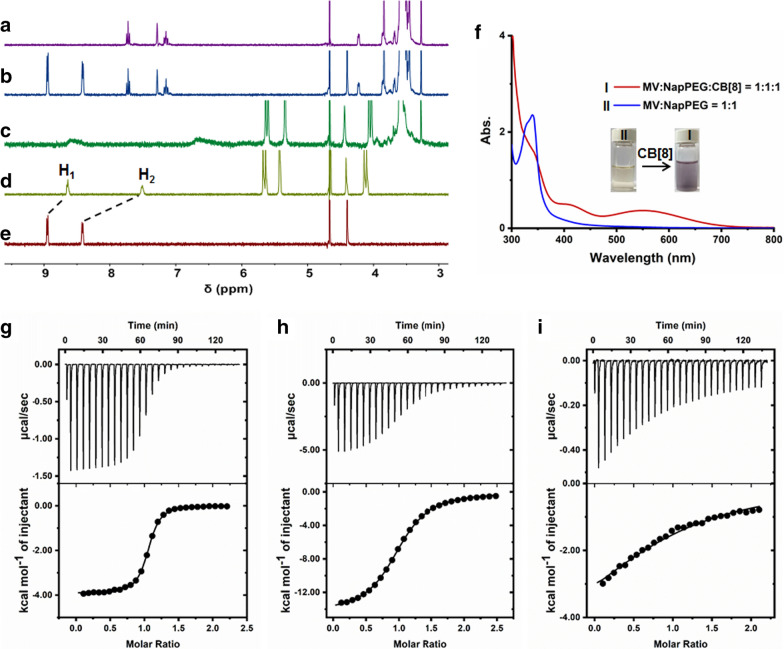
Fig. 1.
1H NMR spectra of a Nap-PEG, b Nap-PEG + MV, c Nap-PEG + MV + CB[8], d CB[8] + MV, and e MV in D2O containing phosphate buffer (20.0 mM). f UV–vis spectra of the solution containing Nap-PEG (500 μM) and MV (500 μM) with/without of CB[8] (500 μM). g ITC data and fitting curve of MV (1.00 mM) titrated into CB[8] (0.100 mM) in phosphate buffer (20.0 mM) at 298.1 K. h ITC data and fitting curve of Nap-PEG (1.00 mM) titrated into the solotion of CB[8] (0.100 mM) and MV (0.100 mM) in phosphate buffer (20.0 mM) at 298.1 K. i ITC data and fitting curve of Nap-PEG (500 μM) titrated into the solotion of CB[8] (50.0 μM) and MV (50.0 μM) in DMEM cell culture medium at 298.1 K

