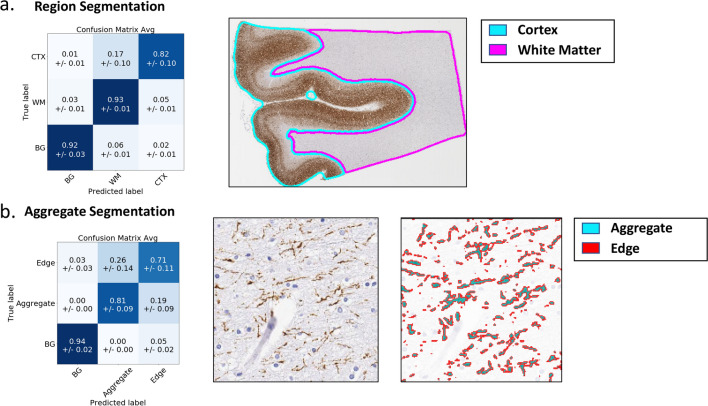
Fig. 2.
DL accurately identifies tissue regions and AT8-stained aggregates. For both region and aggregate models, a cross-validation scheme was used to generate multiple models, each trained on part of the data and evaluated on the rest. We report performance (left column) using confusion matrices which show how image areas with known true labels (rows) are assigned to different predicted classes (columns). Values denote fractions of patches/aggregates belonging to true class (i.e., rows add up to one) assigned to corresponding predicted class averaged across cross-validation models, with standard deviations shown in parenthesis. Right column shows sample classification results. Note: BG = Background. a Region segmentation: threefold cross validation was used and performance is measured in terms of fraction of image-patches from a region that are correctly classified (diagonal entries in dark blue). b Aggregate segmentation: twofold cross validation was used and performance is measured in terms of fraction of pixels that are correctly classified

