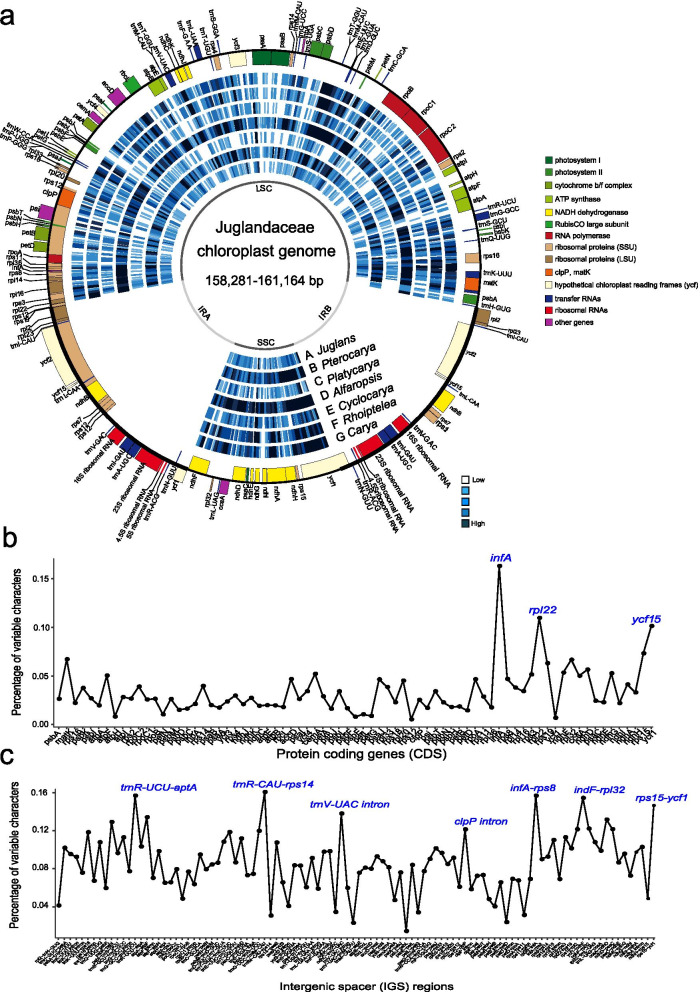
Fig. 2.
Variability of the family Juglandaceae represented over the circular map of Juglans regia, and comparison of percentage of variable characters in Juglandaceae plastomes. a Circular map comparing the chloroplast genomes of the genera of the walnut family (the reference chloroplast genome sequence NCBI accession number: KT963008; Hu et al. 2016a). The two inverted repeat regions (IRa and IRb) separate the large (LSC) and small (SSC) single copy regions, respectively. Genes represented by outside rectangles are on the positive strand, genes represented by inside rectangles are on the negative strand. Density of chloroplast SNPs is represented by a heatmap that varies from low (white) to high (dark blue). The circle depicts average SNP density estimated in 350 bp moving windows. Carya = Carya cathayensis, Rhoiptelea = Rhoiptelea chiliantha, Alfaropsis = Alfaropsis roxburghiana, Platycarya = Platycarya strobilacea, Pterocarya = Pterocarya fraxinifolia, Juglans = Juglans ailantifolia. Comparison of percentage of variable characters in Juglandaceae plastomes. b Protein-coding genes (CDS), c Intergenic spacer (IGS) regions. The peaks labeled in blue were highly variable genes or regions

