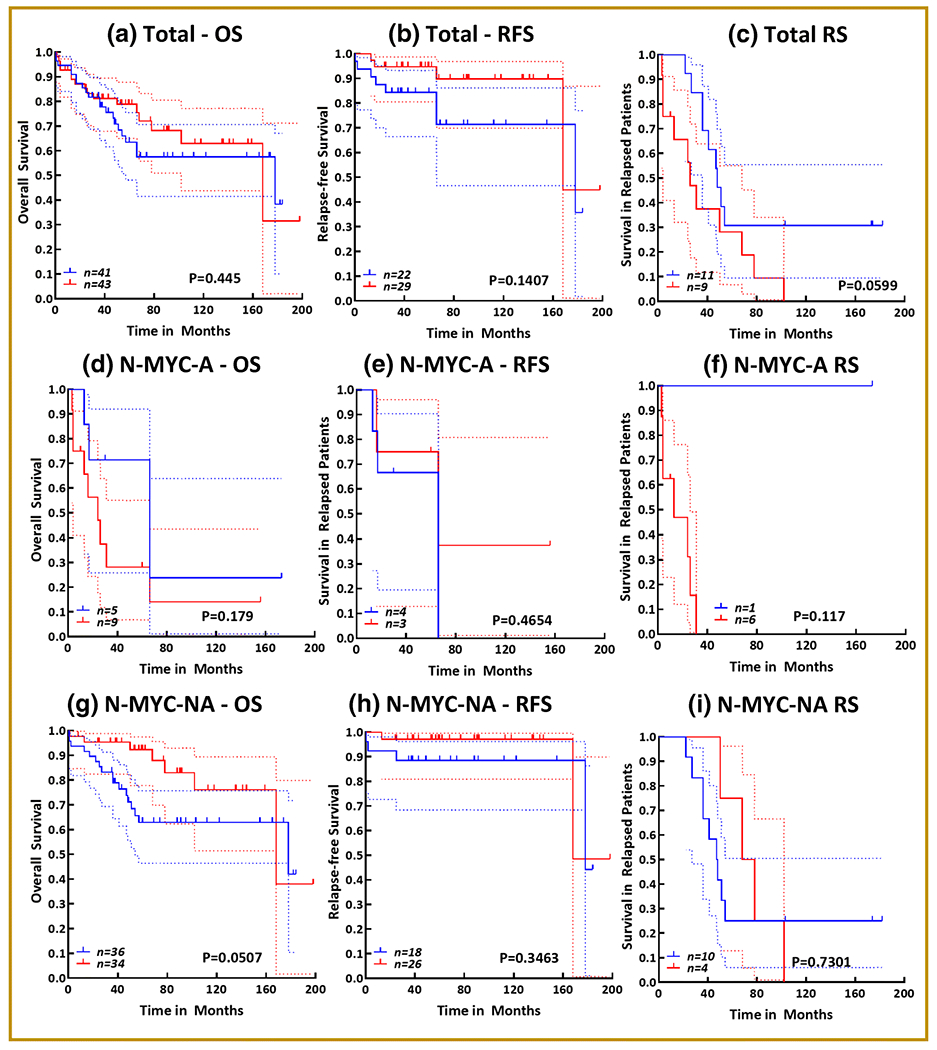
Figure 2. Presence of CD34+ expressing cells in NB clinical outcomes:

Kaplan-Meier curves showing the association of the presence of CD34+ cells with (a) overall survival, (b) relapse-free survival, and (c) survival in patients with relapsed disease in a cohort of 84 NB patients. Kaplan-Meier curves showing the association of the presence of CD34+ cells with (d) overall survival, (e) relapse-free survival, and (f) survival in patients with relapsed disease in a cohort of 14 N-MYC amplified NB patient subset. Kaplan-Meier curves showing the association of the presence of CD34+ cells with (g) overall survival, (h) relapse-free survival, and (i) survival in patients with relapsed disease in a cohort of 70 N-MYC non-amplified NB patient subset. All survival analysis (log rank Mantle cox test and hazard ratio) and Kaplan-Meier curves were performed in GraphPad Prism. Blue = absence of CD34+ cells; Red = presence of CD34+ cells; dotted lines = 95% confidence interval.
