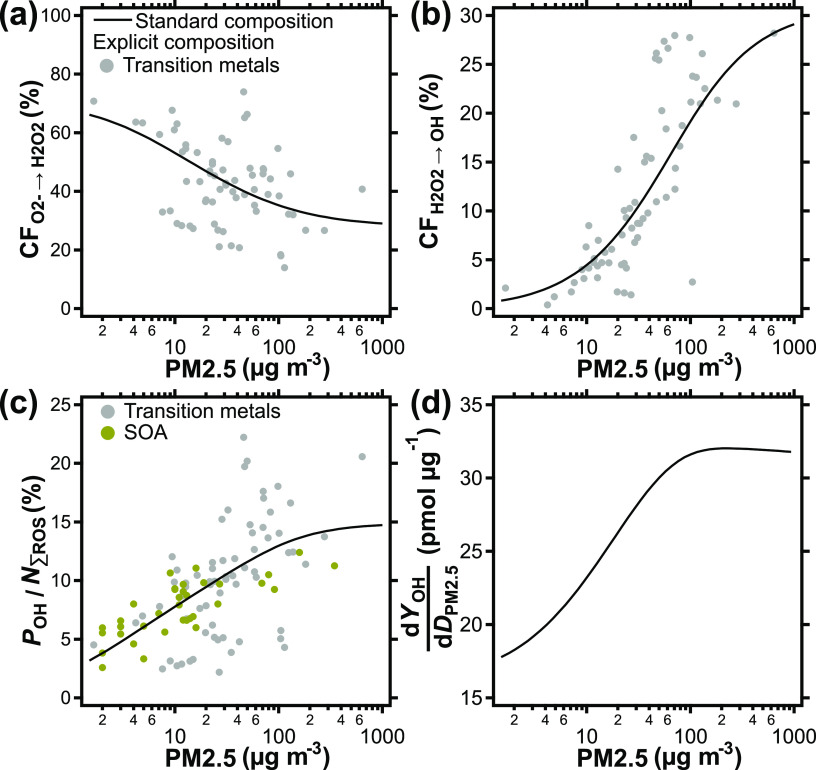
Figure 3.
(a) ROS conversion fractions (CF) for the conversion of O2– to H2O2 and (b) the conversion of H2O2 to OH as a function of ambient PM2.5 concentration. (c) OH fraction of the total cumulative ROS production expressed as a percentage and (d) the change in OH yield per change in PM2.5 dose in the ELF as a function of PM2.5 concentration. CF represents the fraction of the total produced ROS that undergo the indicated conversion pathway as opposed to being scavenged, exhaled, or accumulated in the ELF within 2 h of simulation time. The lines represent a standard PM2.5 composition; the markers in (a–c) show the effect of using explicit PM2.5 composition data (Table S5).

