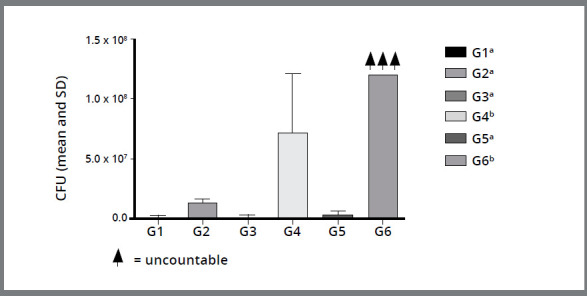
Figure 3: Column diagram of Colony Forming Unit values (mean and standard deviation) representing the antimicrobial activity of different probiotics and negative control. Different superscript letters indicate statistically significant difference between groups (p< 0.05).

