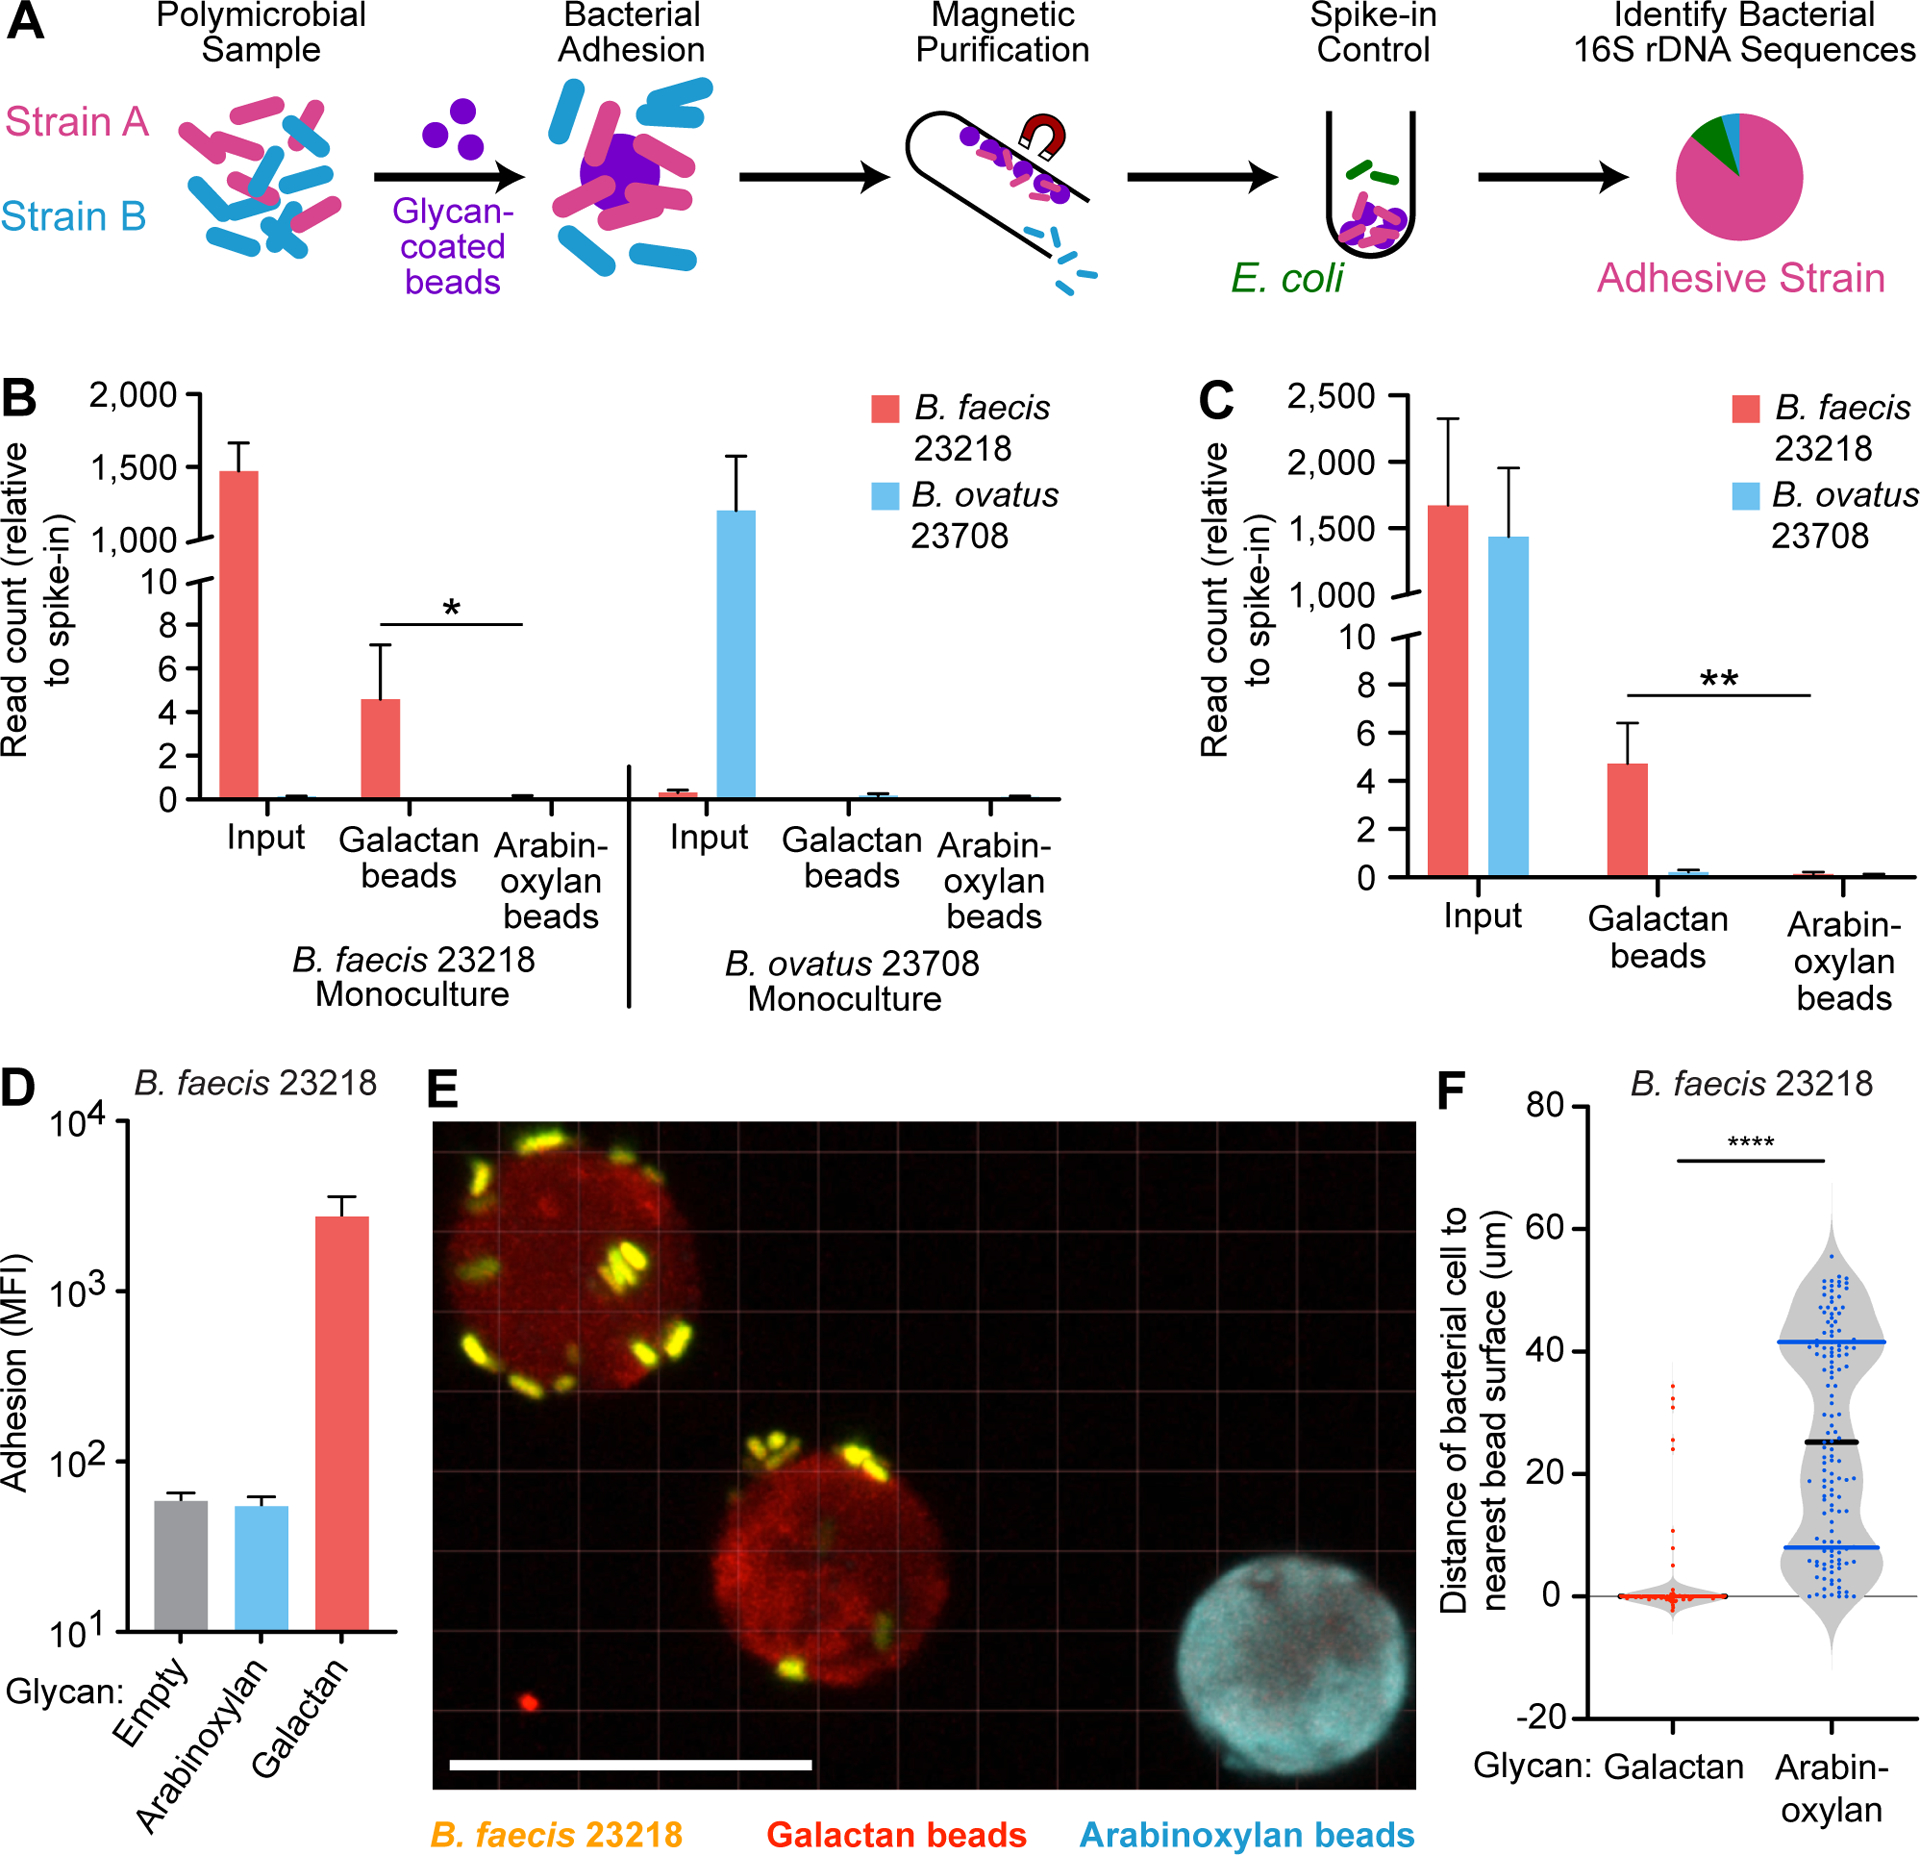
Figure 3: 16S rDNA-based and confocal image-based analyses of the specificity of bacterial binding to dietary glycans.

(A) Schematic depicting the implementation of beads to identify adhesive species in a mixed microbial culture using 16S rDNA sequencing. (B) Quantification of B. faecis 23218 and B. ovatus 23708 associated with galactan or arabinoxylan beads after their incubation with the indicated strains grown in monoculture. The Y-axis denotes V4–16S rDNA read count relative to E. coli spike-in control read count for each sample (n=3 separate adhesion assays; mean + sd is plotted for each group; *, p<0.05; t-test). (C) Quantification of B. faecis 23218 and B. ovatus 23708 associated with galactan or arabinoxylan beads after incubation with the both strains in a 1:1 mixed culture. The Y-axis denotes read count relative to E. coli spike-in control read count for each sample (n=4 separate adhesion assays; mean + sd is plotted for each group; **, p<0.005; t-test). (D) Fluorescence measurement of adhesion of B. faecis 23218, grown and assayed by flow cytometry in triplicate, incubated with a mixture of three bead types. Log10 geometric mean fluorescent intensity in the Syto-82 channel for each bead type in each sample is indicated on the y-axis (mean + sd). (E) Confocal image of galactan beads (red) and arabinoxylan beads (blue) incubated with B. faecis 23218 cells (yellow) in vitro. Scale bar, 20μm. (F) Quantification of distances from bacterial isosurfaces to the nearest isosurface of each bead type from the experiment shown in panel B. Each dot represents a bacterial isosurface (n=143 isosurfaces scored; median and quartiles are shown in the violin plots). ****, p<0.001 (Mann-Whitney U test).
