
Figure 4: Adhesion of bacteria to glycan-beads in gnotobiotic mice.
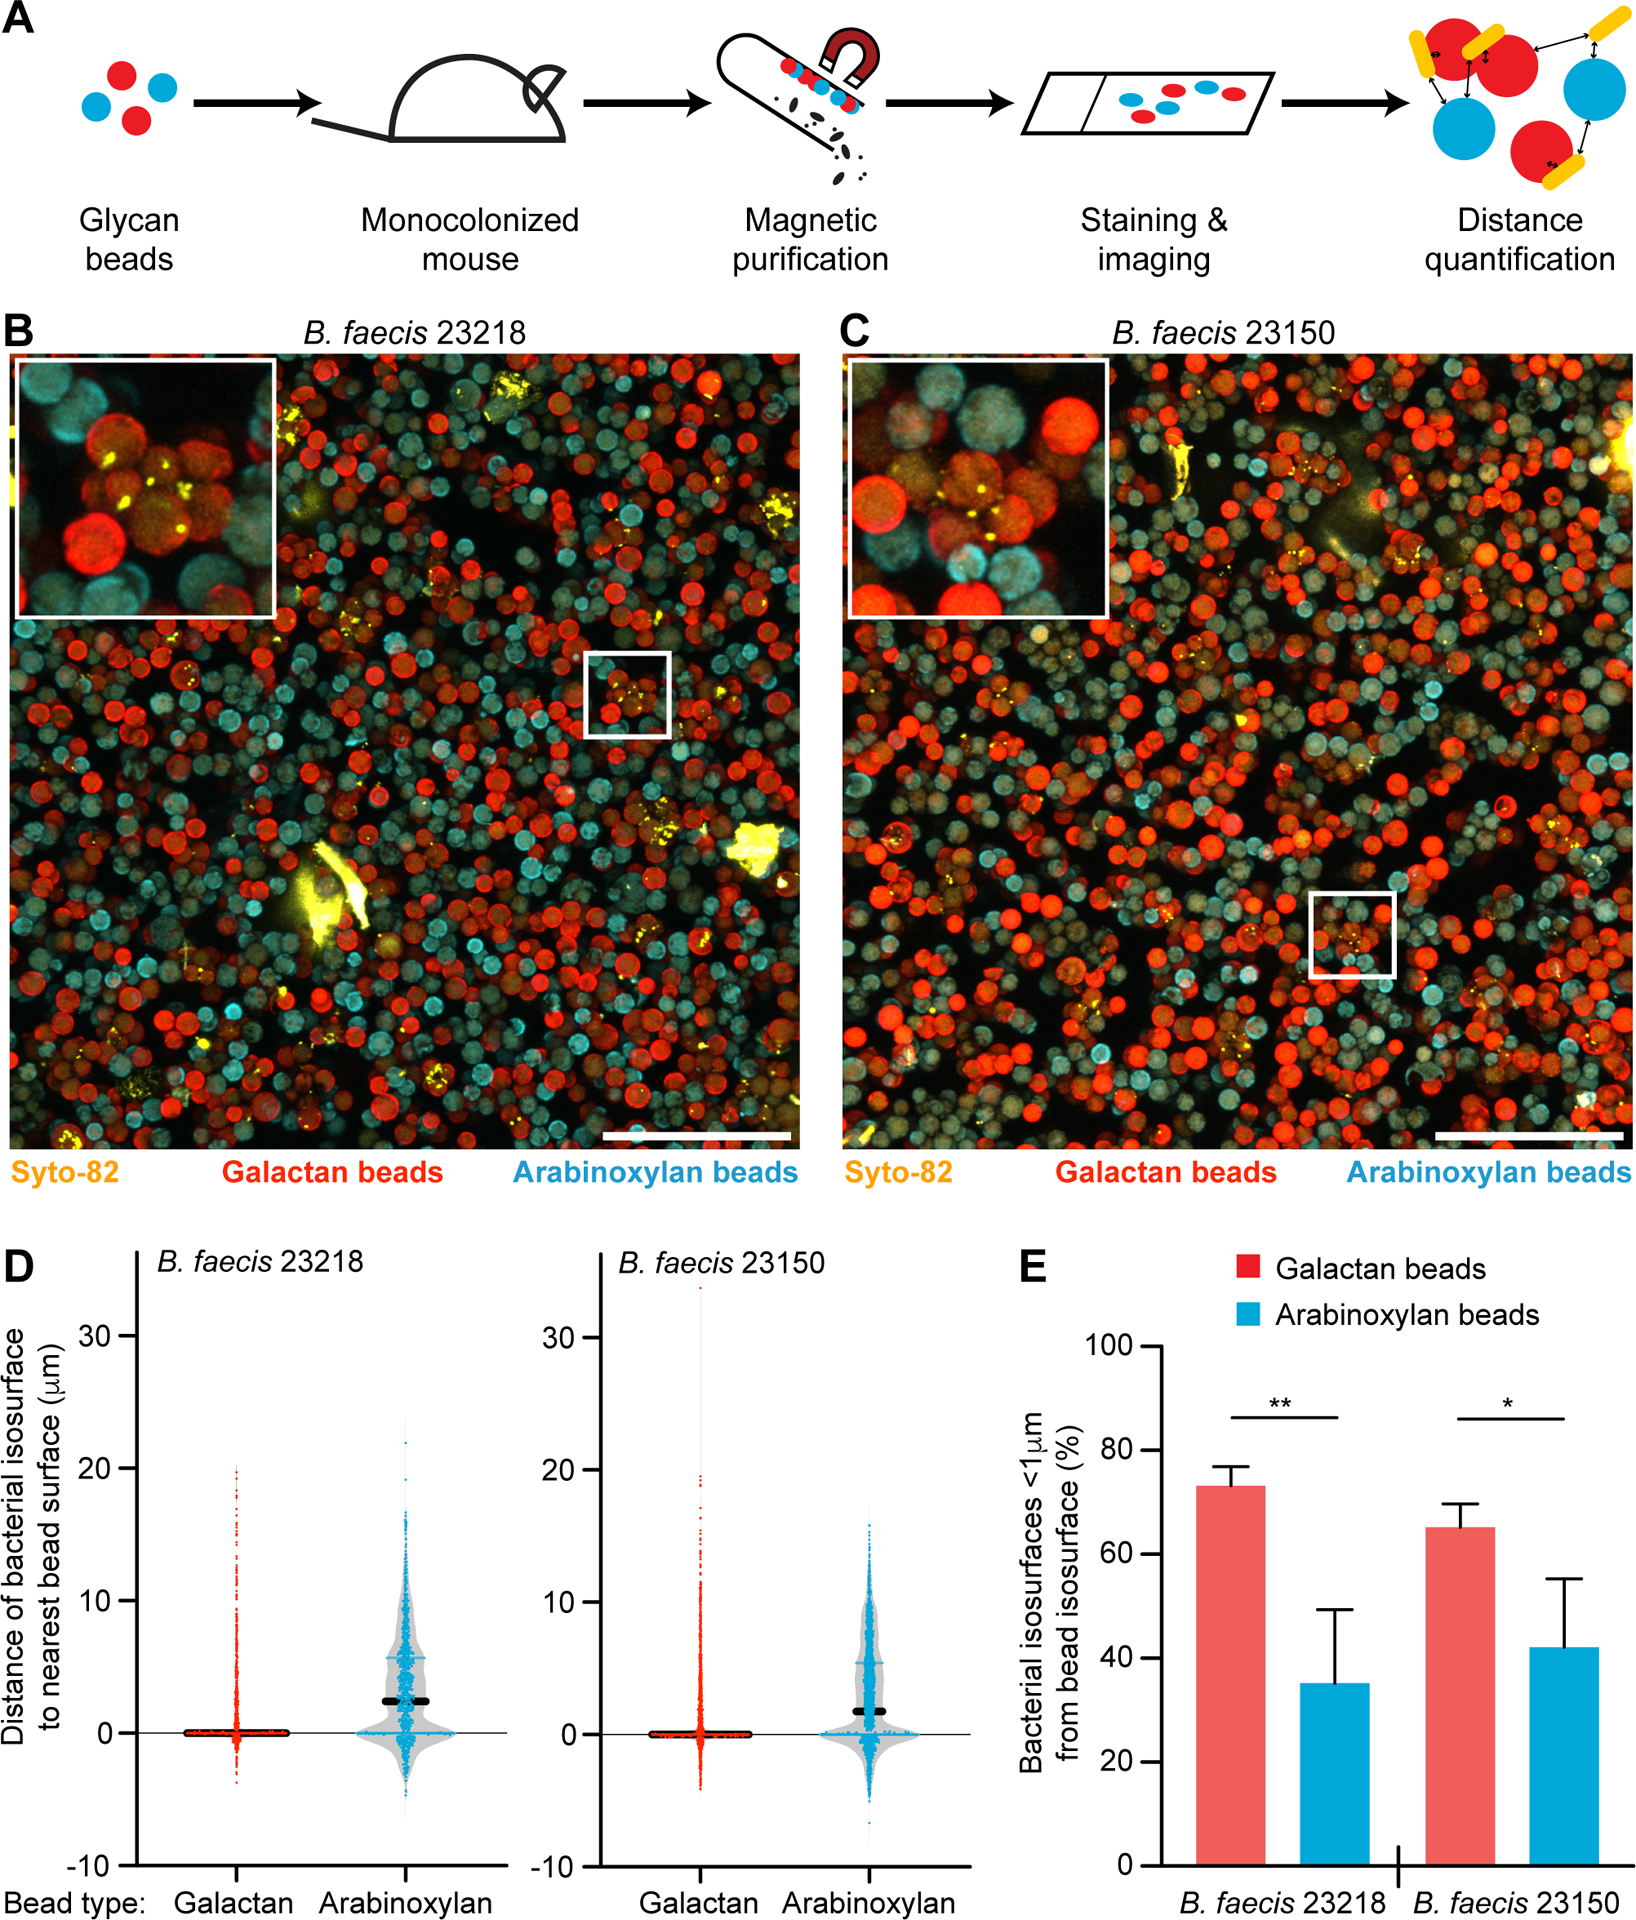
(A) Schematic depicting the oral gavage, isolation, quantitative imaging of beads administered to monocolonized gnotobiotic mice to test for in vivo bacterial adhesion to distinct dietary glycans. (B,C) Beads were recovered from cecal contents 4.5 hours after their administration to gnotobiotic mice monocolonized with either B. faecis 23218 or B. faecis 23150. Recovered beads were embedded in agarose, tiled confocal z-stacks were acquired, and maximum intensity projections were generated. Syto-82 labeled bacterial cells (yellow), arabinoxylan beads (cyan), and galactan beads (red) are shown. Scale bar, 100 μm. Insets depict aggregates of beads with bound bacterial cells. (D) Representative plots (one of four mice analyzed per group) show the shortest distances between each bacterial isosurface and the nearest bead surface. Distances are negative if the bacterial surface lies completely within the borders of the bead surface. Dots represent bacterial isosurfaces (n=473–1780 bacteria quantified per mouse) (E) The percentage of bacterial isosurfaces within 1 μm of each bead type isosurface is plotted (n=4 mice/strain; bars show mean + sd; *, p<0.05; **, p<0.01; t-test).