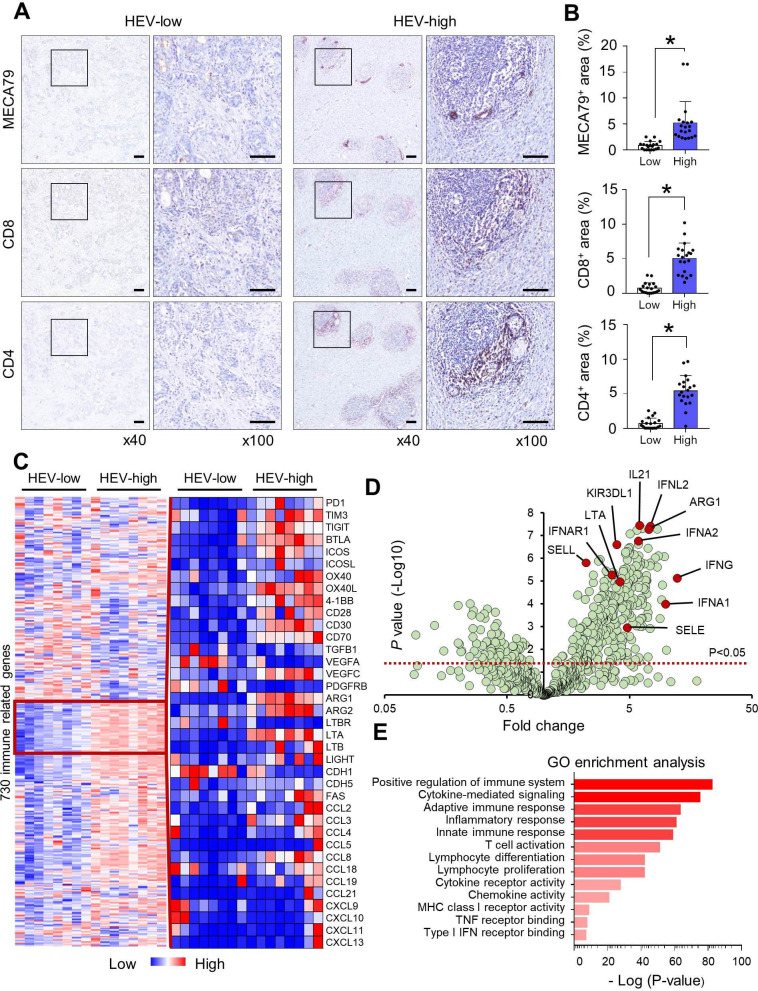
Figure 1.
HEV density was a surrogate marker for T-cell inflamed TME. (A) HEV expression (detected by MECA-79 staining) in surgically resected GC tissue was categorized into low and high status based on the median value of HEV density (27.8/cm2). Lymphocytes were stained with anti-CD8 and anti-CD4 antibodies for evaluating their relationship with HEV density. Scale bars: 200 µm. (B) Quantification of the MECA-79 area and the CD8+ and CD4+ areas according to the HEV-low and HEV-high groups was performed, and their significant correlations are shown. Values are presented as mean±SEM. (C) The differences in the expression of 730 immune-related genes were evaluated, and genes for immune checkpoints, TME, and chemokines varied with HEV density. (D) Volcano plot summarizing the effects of HEV density on immune-related gene expression. Red line, p<0.05. (E) GO term enrichment analysis revealed 13 statistically significant biological processes controlled by differentially expressed genes among patients with high HEV density. *P<0.05. GC, gastric cancer; GO, gene ontology; HEV, high endothelial venule; IFN, interferon; MHC, major histocompatibility complex; TME, tumor microenvironment; TNF, tumor necrosis factor.

