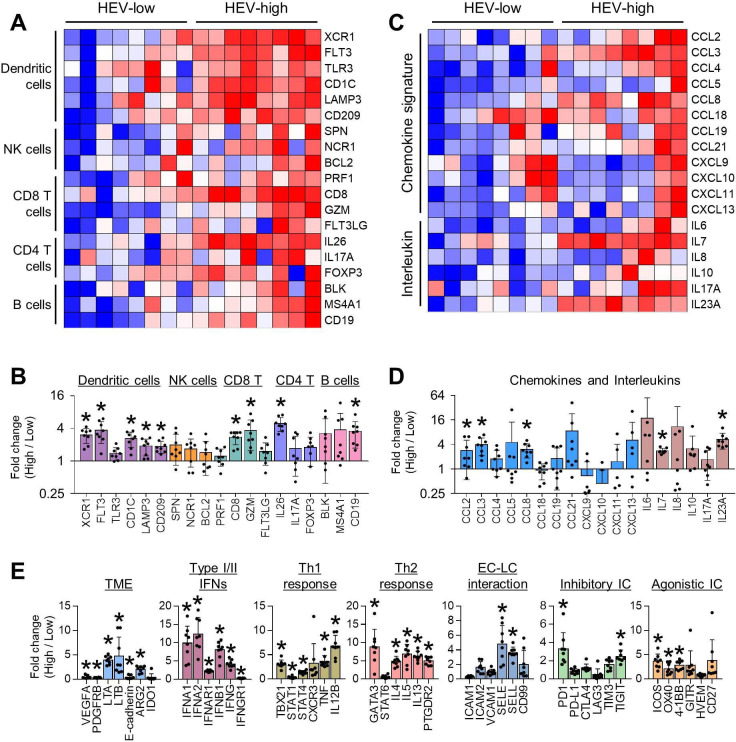
Figure 2.
Immune-related gene expression profile explained the anti-tumor immunity of HEV-high GC. (A) HEV-high GC had increased expression of immune cell subsets, including dendritic cells, cytotoxic and helper T cells, and B cells. (B) Fold changes of gene expression of immune cell subsets in HEV-high GC compared to HEV-low GC. Values are presented as mean±SEM. *P<0.05. (C) Gene expression of immune-modulating chemokines and interleukins was higher in HEV-high GC. (D) Fold changes of chemokines and interleukins in HEV-high GC compared with HEV-low GC. Values are presented as mean±SEM. *P<0.05. (E) Comparison of gene expression related to TME, type I or II interferon, Th1 and Th2 response, EC–LC interaction, and inhibitory and agonistic immune checkpoint between HEV-high and HEV-low GC. Values are presented as mean±SEM. *P<0.05. EC, endothelial cell; GC, gastric cancer; HEV, high endothelial venule; IC, immune checkpoint; IFN, interferon; LC, lymphocyte; NK, natural killer; TME, tumor microenvironment.

