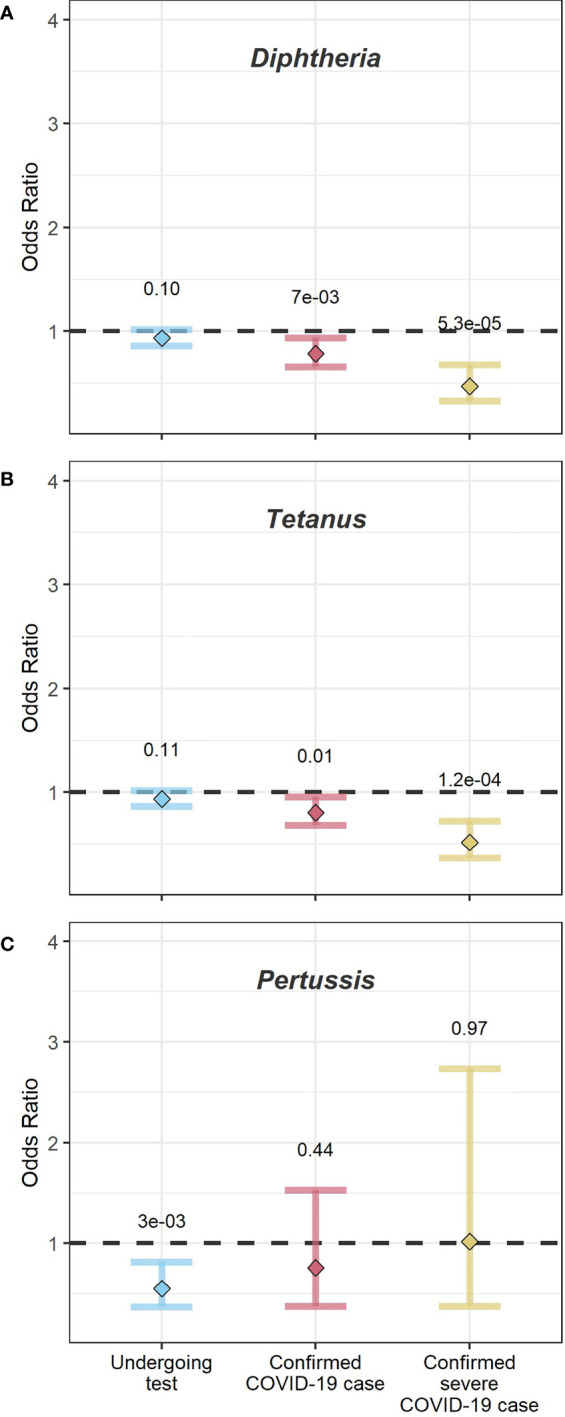
Figure 1.

Dot-and-whisker plots from logistic regression analysis across the full sample. The y-axis shows the odds ratios. The x-axis shows the three logistic regression analysis performed (1): undergoing a COVID-19 test (left, blue) (2), being a confirmed COVID-19 case (middle, red), and (3) being a confirmed severe COVID-19 case (yellow, right). Dots indicate the mean odds ratio, and whiskers the 95% confidence intervals. The numbers above the whiskers show the p-value for each analysis. Panel (A) shows the outcome for participants vaccinated for diphtheria, relative to those with no record of a diphtheria vaccination, (B) shows the outcome for participants vaccinated for tetanus relative to those with no record of tetanus vaccination; and (C) shows the outcome for participants vaccinated for pertussis relative to those with no record of vaccination for pertussis.
