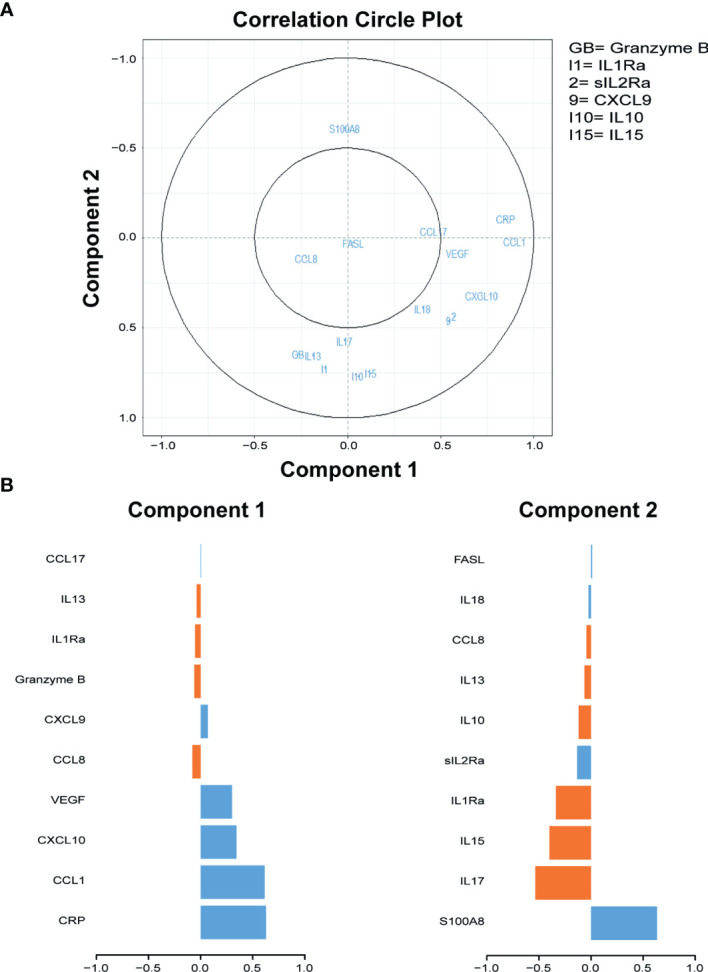
Figure 1.

Sparse partial least squares regression analyses of 40 cytokines measured in serum samples of individuals diagnosed with ATB and untreated LTBI. (A) Correlation circle plots representing the correlations between the cytokines and the first two components of the sPLS. A correlation circle is a two-dimensional plot helping the interpretation of the correlations between the initial variables (i.e., the cytokines) and the new variables (i.e., the components) that are combinations of the first ones: the closer a variable is to an axis and to the circle, the higher the correlation with the corresponding component will be. It is also a way to plot the correlations between the cytokines: if two cytokines are in opposite quarters, they are negatively correlated; if two cytokines are perpendicular, then their correlation is close to 0; if two variables are close, their correlation is close to 1. Top 10 cytokines of the first two components are shown in the graph. GB, Granzyme B; I1, Il1Ra; 2, sIL2Ra; 9, CXCL9; I10, IL-10; I15, IL-15. (B) The contribution (i.e., the correlation) of the top 10 cytokines for components 1 and 2. The blue bars represent ATB, and the orange bars represent untreated LTBI. ATB, active tuberculosis; untreated LTBI, latent tuberculosis infection without prophylaxis; sPLS, sparse partial least squares.
