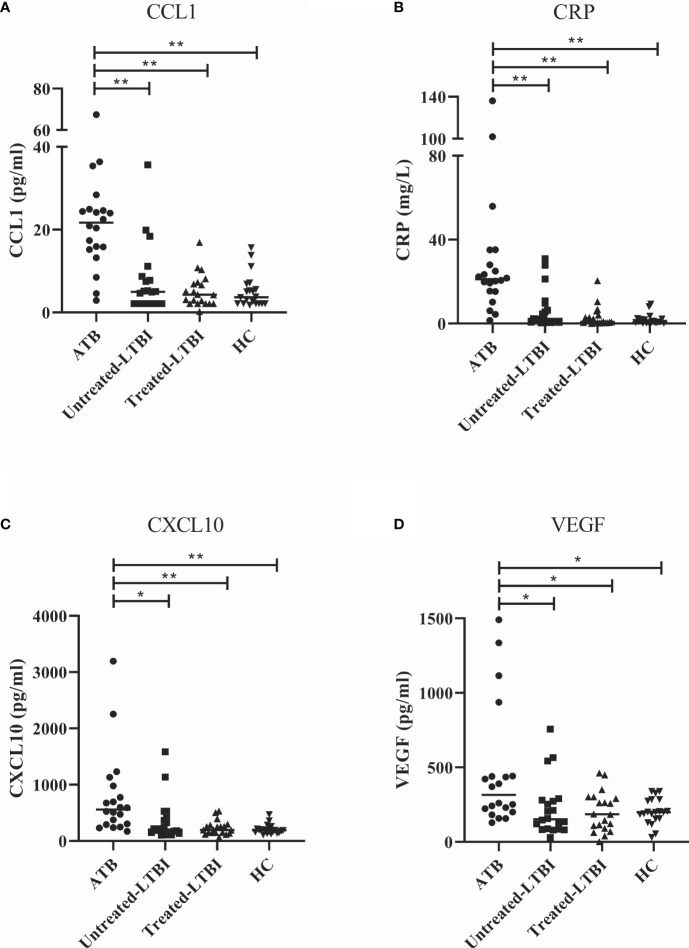
Figure 2.
Serum levels of CCL1 (A), CRP (B), CXCL10 (C), and VEGF (D) in individuals with ATB, untreated LTBI, and treated LTBI and HCs. All groups were compared for each marker using Mann–Whitney U tests. In panels (A–D), the filled dots represent participants with ATB, the filled squares represent the participants with untreated LTBI, the filled triangles represent the participants with treated LTBI, and the filled inversed triangles represent the HCs. The horizontal line in each study group represents the median concentration. ATB, active tuberculosis; CCL1, C-C motif chemokine ligand 1; CRP, C-reactive protein; CXCL10, C-X-C motif chemokine ligand 10; HC, healthy controls; untreated LTBI, latent tuberculosis infection without prophylaxis; treated LTBI, latent tuberculosis infection after completion of prophylaxis; VEGF, vascular endothelial growth factor. * 0.001 < p < 0.05, ** p < 0.001.

