
Fig. 6. TSLP induced killing of MRSA is mediated by reactive oxygen species.
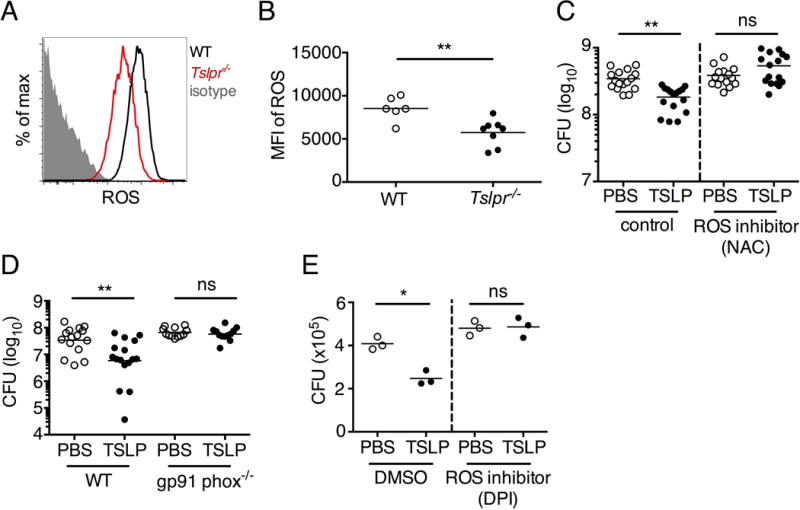
(A–C) Day 1 p.i. of mice infected with MRSA i.d. in the ear. (A–B) ROS production of mouse neutrophils after staining with CellROX deep red. Shown are a representative FACS plot (A) and mean fluorescence intensity (MFI) (B) of WT (n=6) and Tslpr−/− mice (n=8 ears). (C) Mice were injected i.d. in the ear with MRSA and either PBS or TSLP along with either control (PBS) or a ROS inhibitor (NAC). CFU on day 1 p.i. (two-tailed Mann-Whitney test, n=16 ears). (D) CFU in the ear on day 2 p.i. of WT and Gp91 phox−/− mice infected with MRSA and PBS or TSLP (two-tailed Mann-Whitney test, n=12–16 ears). (E) Purified human neutrophils were pretreated with DMSO or DPI, treated with PBS or TSLP, and incubated for 2 h with MRSA. CFU was then determined (representative donor shown in triplicate, statistics shown are using a two-tailed paired-t test of 3 donors, 3 independent experiments). *, p < .05; **, p < .01; ***, p < .001; ns = not significant. (b) Two-tailed Student’s t-test. Data are representative of 3 independent experiments (A, B) or are combined data from two independent experiments (C&D).