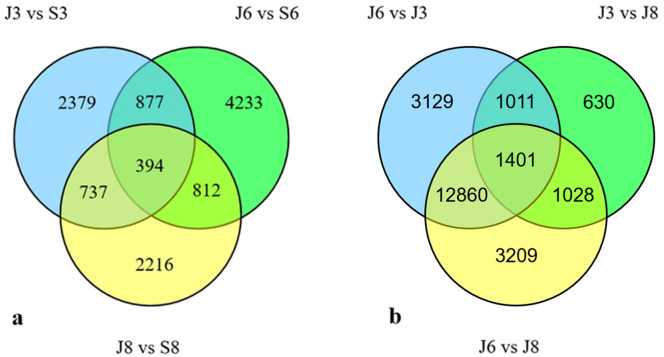
Figure 3. Venn diagram of DEGs.
(A) Venn diagram showing the DEGs between the sterile water and spore suspension treatments for varieties #3, #6 and #8. (B) Venn diagram showing the DEGs between varieties #3, #6 and #8 after spore suspension treatment. (J indicates inoculated A. phaeospermum, S indicates inoculated sterile water).

