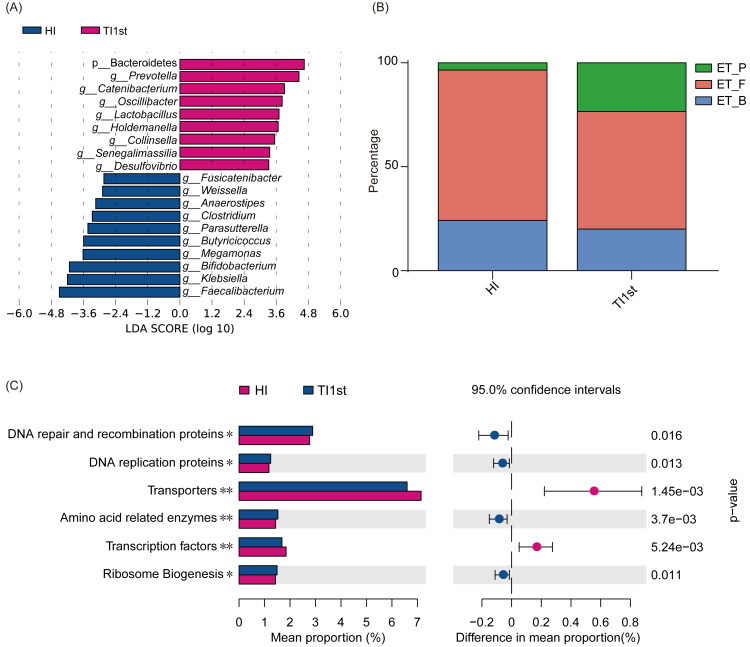
Figure 3. Comparison of biomarkers, enterotypes, and KEGG pathways between Tibetan and Han women.
(A) LEfSe analysis results for the HI and TI1st groups; LDA score was set to 2.0. (B) Comparison of enterotype between HI and TI1st groups, P > 0.05, χ2 = 4.97. (C) The significantly different KEGG pathways between the HI and TI1st groups, * P < 0.05, ** P < 0.01.

