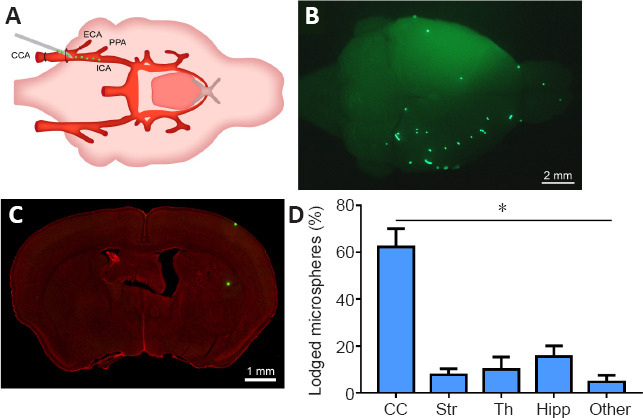
Figure 1.

Injection and distribution of fluorescent microspheres.
(A) An illustration for the injection of fluorescent microspheres into the right side of the common carotid artery (CCA) of mice. (B) A representative photograph from the brain surface of mouse under the fluorescence stereomicroscope showing a typical distribution of fluorescent microspheres (green dots) lodged in blood vessels of the cerebral cortex. (C) A representative photograph from the coronal section of mouse brain with fluorescent Nissl staining showing the lodged microspheres (green dots) on the cortical surface and in the striatum. Scale bars: 2 mm in B, 1 mm in C. (D) The distributional percentage of microspheres in the different regions including the cerebral cortex (CC), striatum (Str), thalamus (Th), hippocampus (Hipp), and other regions. Data are expressed as mean ± SEM (n = 6) and were analyzed by Kruskal-Wallis test. *P < 0.05. ECA: External carotid artery; ICA: internal carotid artery; PPA: pterygopalatine artery.
