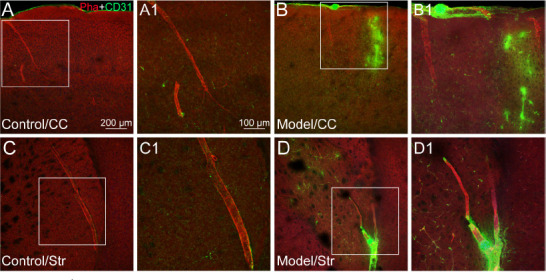
Figure 2.

The vascular alteration induced by fluorescent microspheres.
(A–D) The representative photographs from the cerebral cortex (CC; A and B) and striatum (Str; C and D), showing the histological features of phalloidin (Pha, red, Alexa Fluor 568)- and CD31 (green, Alexa Fluor 488)-labeled blood vessels in the cases of control (A and C) and experimental model (B and D). (A1–D1) Magnified photographs from the box-indicated regions in panels A–D showing Pha- and CD31-labeled blood vessels in detail, respectively. CD31 labeling expressed more strongly in the regions of microinfarct than that of control. The vascular alteration in all model mice presented in a similar pattern (n = 6). Green dots in panels B/B1 (upper edge) and D/D1 (lower edge) are the lodged fluorescent microspheres. Scale bars: 200 μm in A–D, 100 μm in A1–D1.
