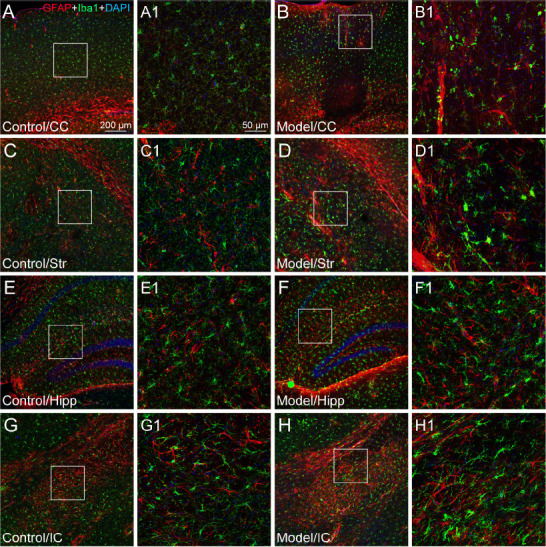
Figure 4.

The astroglial and microglial activation in different regions of microinfarcts.
(A–H) The representative photographs from the cerebral cortex (CC, A and B), striatum (Str, C and D), hippocampus (Hipp, E and F), and internal capsule (IC, G and H) showing the glial fibrillary acidic protein (GFAP, red, Alexa Fluor 594)-labeled astrocytes and ionized calcium binding adapter molecule 1 (Iba1, green, Alexa Fluor 488)-labeled microglia in the cases of control (A, C, E, G) and experimental model (B, D, F, H). (A1–H1) Magnified photographs from the box-indicated regions in panels A–H showing the GFAP- and Iba1-labeling in detail. In the controls, the resting astrocytes and microglia were delicate in form and were distributed evenly in the different regions. In contrast, active astrocytes and microglia in the region of microinfarcts presented with enlarged cell bodies and the thicker cellular processes gathering around the wall of blocked vessels or scattered within the region of the microinfarcts. The astroglial and microglial activation in all model mice presented with the similar pattern (n = 6). The green dot in panel F is a lodged fluorescent microsphere near the hippocampus. Scale bars: 200 μm in A–H, 50 μm in A1–H1. DAPI: 4′,6-Diamidino-2-phenylindole.
