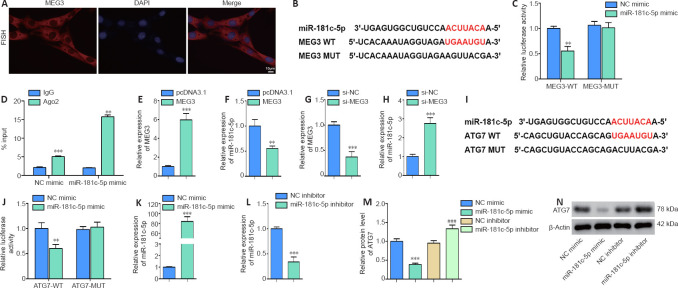
Figure 3.
MiR-181c-5p interacts with MEG3 and ATG7.
(A) The fluorescence in situ hybridization assay was performed to identify the cellular localization of MEG (red; original magnification 200×; scale bar: 10 μm). (B, C) The luciferase plasmid containing MEG3-WT or MEG3-MUT and miR-181c-5p mimic or control (NC mimic) were co-transfected into HT22 cells to examine luciferase activity. Red bases represent the complementary sequences and binding sites. Relative luciferase activity = firefly luciferase activity/renilla luciferase activity. (D) RIP assay was performed to verify the interaction of miR-181c-5p and MEG3. %Input = MEG3 enrichment/input (1) × 100. (E–H) MEG3 overexpression plasmid (MEG3), si-MEG3, or their control (pcDNA3.1 or si-NC, respectively) was transfected into HT22 cells. The levels of MEG3 and miR-181c-5p were quantified by qRT-PCR. The expression was normalized to the pcDNA3.1 or si-NC group. (I, J) The luciferase plasmid containing ATG7-WT or ATG7-MUT and miR-181c-5p mimic or control (NC mimic) were co-transfected into HT22 cells. Red bases represent the complementary sequences and binding sites. Luciferase activity was measured. (K–N) miR-181c-5p mimic, miR-181c-5p inhibitor, or their control (NC mimic or NC inhibitor, respectively) was transfected into HT22 cells. The levels of miR-181c-5p and ATG7 were measured by qRT-PCR and western blotting, respectively. The target miRNA/protein expression was normalized to the pcDNA3.1 or si-NC group. All data are representative of three independent experiments (mean ± SD). **P < 0.01, ***P < 0.001, vs. NC mimic, pcDNA3.1, or si-NC group; ###P < 0.001, vs. NC inhibitor (unpaired t-test in C–H and J–L; one-way analysis of variance followed by the least significant difference post hoc test in M). ATG7: Autophagy-related gene 7; CCK8: Cell Counting Kit-8; LC3: light chain 3; MDC: monodansylcadaverine; MEG3: maternally expressed gene 3; OGD/R: oxygen and glucose deprivation/reoxygenation.

