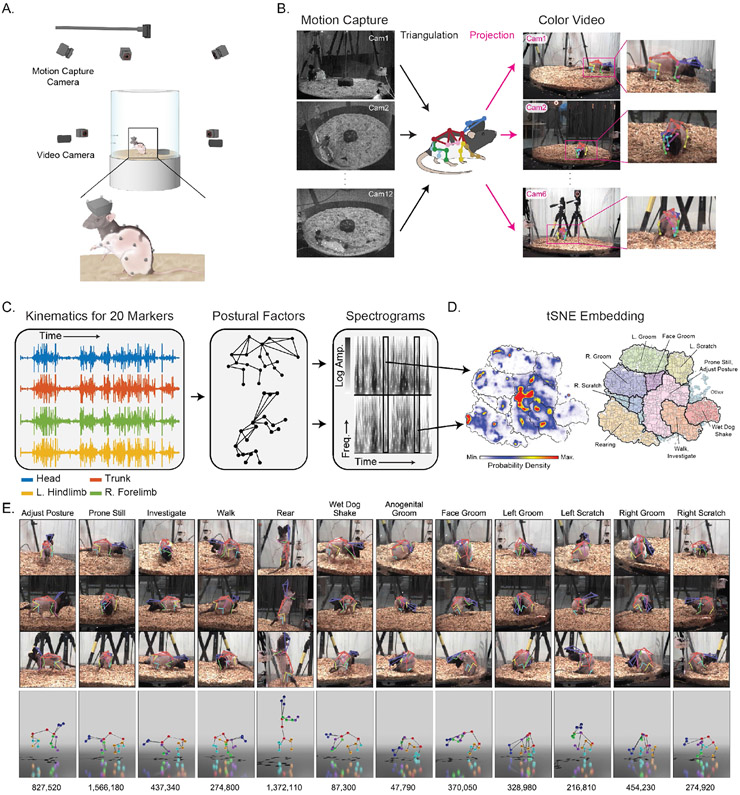
Figure 2 ∣. Rat 7M, a training and benchmark dataset for 3D pose detection.
A. Schematic of the Rat 7M collection setup.
B. Markers detected by motion capture cameras are triangulated across views to reconstruct the animal’s 3D pose and projected into camera images as labels to train 2D pose detection networks.
C. Illustration of process by which tracked landmarks are used to identify individual behaviors. The temporal dynamics of individual markers are projected onto principal axes of pose (eigenpostures) and transformed into wavelet spectrograms that represent the temporal dynamics at multiple scales23.
D. tSNE representations of eigenposture and wavelet traces, as well as behavioral density maps and isolated clusters obtained via watershed transform over a density representation of the tSNE space.
E. Individual examples from each of the high-level clusters outlined in bold in (D). Reprojection of the same 3D pose onto 3 different views (Top) and 3D rendering of the 3D pose in each example (Bottom). The numbers are the total number of example images for each behavioral category. 728,028 frames with motion capture data where animal speed was below the behavioral categorization threshold are excluded.

