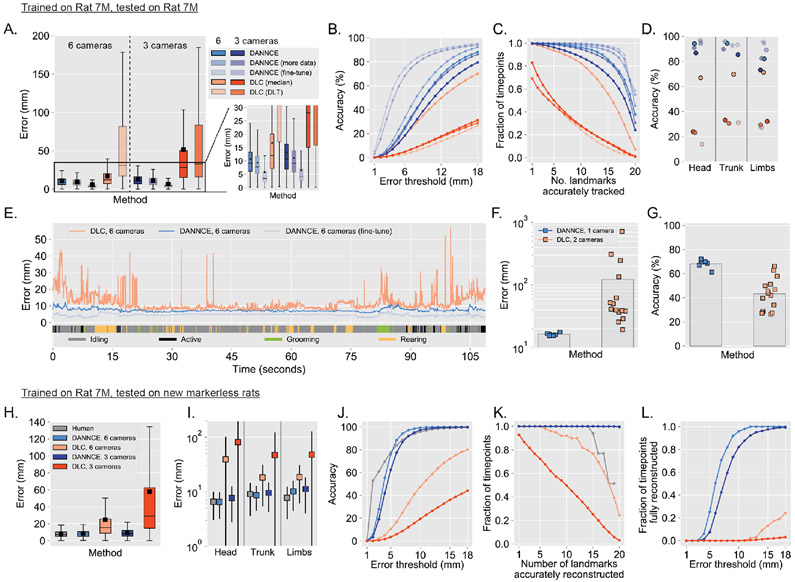
Figure 3 ∣. DANNCE outperforms DLC on rats with and without markers.
A. Box plots of Euclidean error for the indicated methods in a recording using a validation animal not used for training. “More data” is from a model trained with 5 animals rather than 4. “Fine-tune” is after fine-tuning the “more data” model with an additional 225 3D poses from this validation animal for each recording session (Supplementary Fig. 4). In DLC (DLT), the direct linear transformation method was used to triangulate across all cameras8. DLC (median) takes the median of triangulations for all camera pairs. DANNCE 6-camera landmark positions are computed as the median of all 3-camera predictions (Supplementary Fig. 5C). N = 62,680 markers for all 6 camera methods, N = 1,253, 0 markers for all 3 camera methods. Inset colors follow the same legend as to the left and (A-D) use the same color legend. The box plots in (A) and (H) show median with inter-quartile range (IQR) and whiskers extending to 1.5x the IQR. The arithmetic mean is shown as a black square.
B. Landmark prediction accuracy as a function of error threshold, for the same data and methods as in (A).
C. Fraction of timepoints with the indicated number of markers accurately tracked at a threshold of 18 mm, for the same data and methods as in (A).
D. Landmark prediction accuracy at a threshold of 18 mm, broken down by landmark types, for the same data and methods as in (A).
E. Examples showing the Euclidean error over time for a section of recording in the validation animal. Thick colored lines as the bottom denote the type of behavior engaged in over time: grooming (all grooming and scratching), active (walking, investigation, and wet dog shake), rearing, and idling (prone still and adjust posture).
F-G. Mean Euclidean error (F) and accuracy (G) on the validation subject for DANNCE when using a single camera for prediction, vs. DLC when using two cameras. Squares show the mean error for individual camera sets (6 different single camera possibilities for DANNCE, 15 different pairs for DLC; N = 9·106, 2.25·107 markers for DANNCE and DLC, respectively).
H. Box plots of overall Euclidean error in markerless rats relative to triangulated 3D human labels, for each of the indicated methods. N = 3 animals, N = 721 landmarks.
I. Plots showing the mean Euclidean error for the same data and methods as in (H), broken down by landmark type. Each square is the mean and error bars are standard deviation.
J. Landmark reconstruction accuracy as a function of error threshold for the same animals and frames as in (H), but with all landmarks pooled across labelers for Human (N = 1,868), and all 20 predictions per frame for DANNCE and DLC (N = 1,980 and 39,600 landmarks for each 6 camera and 3 camera condition, respectively).
K. Fraction of all frames with the indicated number of landmarks accurately reconstructed at a threshold of 18 mm, for the same data as in (J). The “Human” line is truncated at 19 landmarks because labelers were unable to see the full set of landmarks in at least 2 views.
L. Fraction of all frames fully reconstructed (all 20 landmarks with error below threshold) as a function of the error threshold for the same data as in (J). (I)-(L) use the same colors as in (H).

