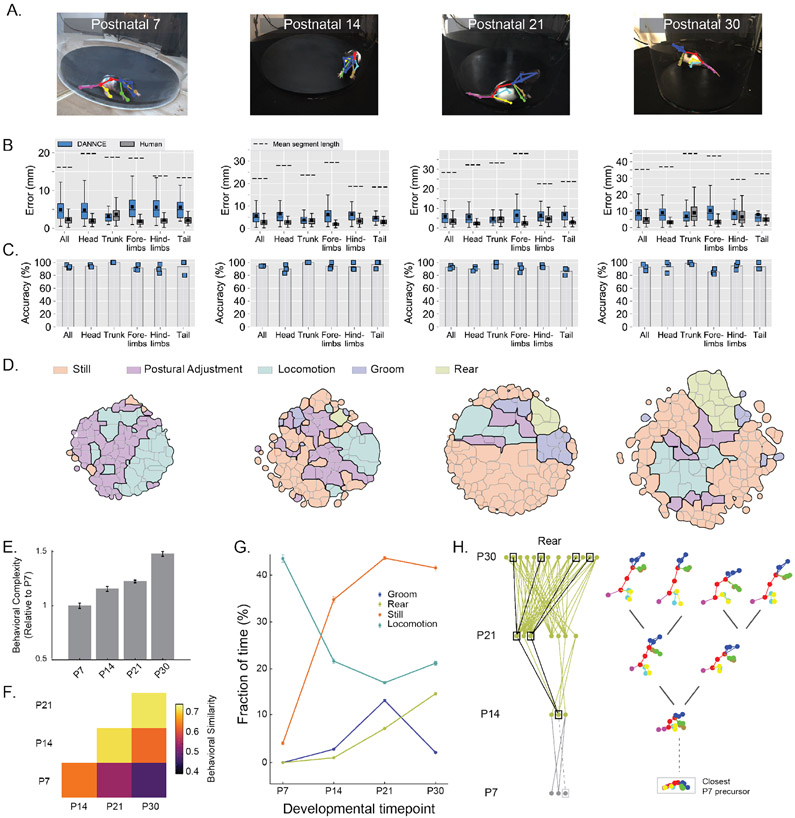
Figure 5 ∣. DANNCE can report the ontogeny of behavioral complexity in rats.
A. Examples of DANNCE landmark predictions projected into a single camera view, for four different developmental stages.
B-C. Box plots of landmark Euclidean error (B) and bar plots of DANNCE mean landmark prediction accuracy (C) in validation subjects for both hand-labeled frames and DANNCE predictions, broken down by landmark type. The box plots show median with IQR and whiskers extending to 1.5x the IQR. The arithmetic mean is also shown as a black square. The mean segment length between landmarks of each type is presented for scale in (B). In (C), Blue squares show the landmark prediction accuracy for individual validation subjects. For each developmental timepoint, N = 3 animals and N = 396 – 417 landmarks.
D. Clustered and annotated maps of pup behavior for each developmental timepoint. We scaled the size of the behavioral maps to reflect the diversity of behaviors observed.
E. Bar plots of behavioral complexity, defined as the range of pairwise distances between behaviors observed in the dataset, normalized to P7 and shown across different developmental timepoints. Error bars reflect the standard deviation of the complexity across 50 bootstrapped samples.
F. Grid quantification of behavioral similarity across developmental stages. For each stage we clustered the behavioral map, identified pairs of clusters across stage pairs with highest similarity, and reported the average highest similarity per cluster.
G. Fractions of time spent in four major behavioral categories. Mean values (circles) were adjusted to reflect the fraction observed by humans in Supplementary Fig. 13. Error bars reflect the expected standard deviation in observations based on Poisson statistics (N = 484-65,008 per category, when present).
H. Ontogeny of rearing behaviors. In the graphs, individual nodes refer to unique behavioral clusters at each stage. Edges connect nodes whose similarity is greater than a set threshold. Wireframe examples show the diversification of rearing behaviors from one initial cluster at P14. This cluster was linked to a P7 behavioral precursor with similarity below threshold (dotted lines). Gray dots and lines for P7 denote that these clusters were not identifiable as rearing movements.

