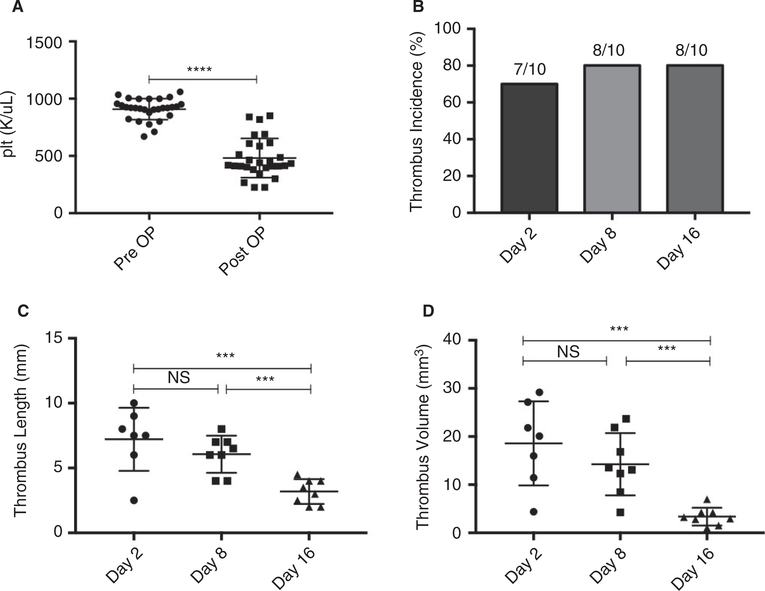
FIGURE 1.
Thrombus length and volume decrease over time in the IVC stenosis model of DVT. A, Pre- and postoperative platelet counts were measured in all mice 24 h before and 24 h after IVC stenosis surgery (n = 30). B, Thrombus incidence in mice that underwent tissue harvest on postoperative day 2 (n = 10), 8 (n = 10), or 16 (n = 10). C, Thrombus length and (D) thrombus volume on postoperative days 2, 8, and 16. Data are reported as mean ± SEM. Unpaired, Student’s t test and χ2test used for statistical analysis. (P < .05*, P < .01**, P < .001***, P < .0001****)

